
How To Make Your Own NFL DFS Projections
August 12, 2026
An NFL DFS projection looks like a black box from the outside. It is not. Underneath, a projection is just a chain of arithmetic that starts with one question and answers it in order: who actually gets the ball, how good are they with it, who are they facing, and what is the game around them going to look like? Learn to build that chain yourself and you stop renting other people's numbers. You start understanding which number in the projection is load-bearing, and that is the whole edge in a game where everyone can buy a projection but almost nobody knows which input is about to be wrong.
This guide shows you how to make your own NFL DFS projections in the exact order our analysts use to project a slate: the free data that feeds each step, and how to turn a raw stat line into DraftKings 🎁 and FanDuel 🎁 points you can trust.
The Quick Answer
To make your own NFL DFS projections, estimate opportunity first (target share, snap share, rush attempts, red-zone touches), multiply it by efficiency (yards per route run, yards per carry, EPA), adjust for the matchup (opponent defense strength, coverage scheme), then anchor the whole offense to its Vegas implied team total and correct for game script and injuries last. Convert the finished stat line to DraftKings (full PPR) or FanDuel (half PPR) points and sanity-check the result against the Stokastic Sims before it goes near a lineup. Below: the exact build order our analysts use, the free data that feeds every step, a worked example that turns one running back's stat line into DraftKings and FanDuel points, and the salary math that tells you whether the number is actually rosterable.
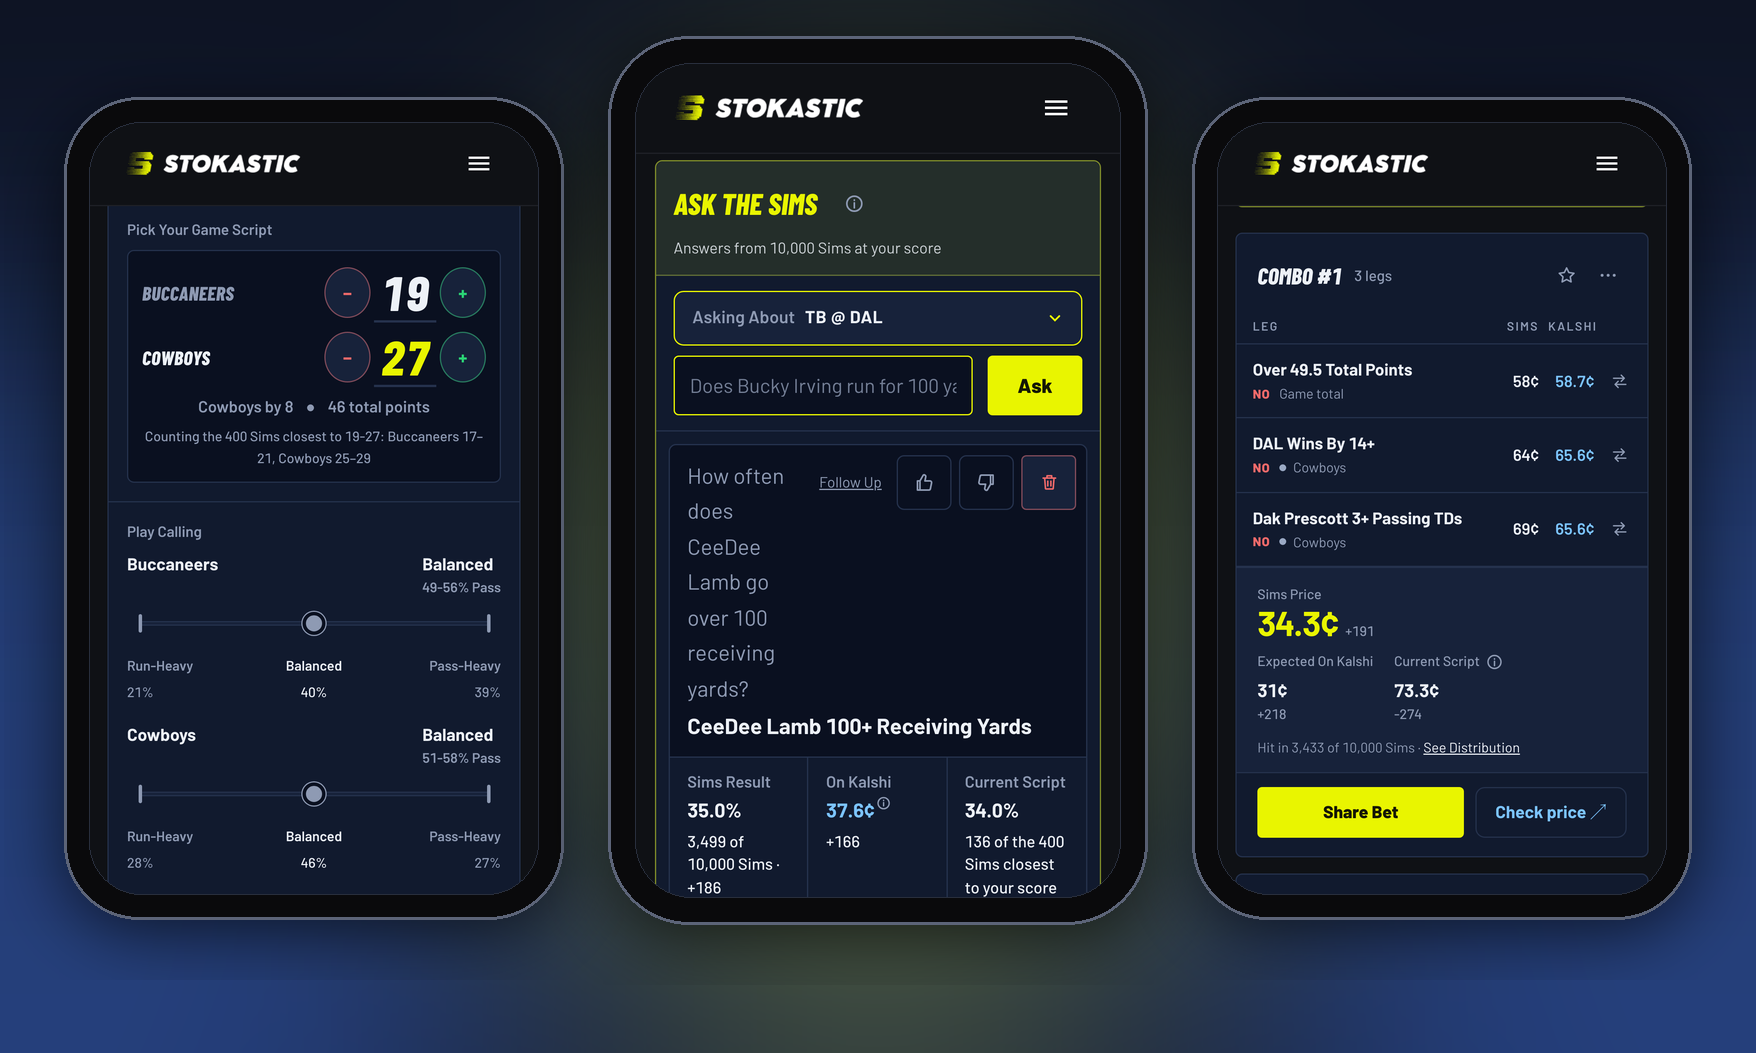 Price the combo before you buy it. The Kalshi Combo Simulator plays this week's NFL game 10,000 times and prices any combo you build next to the price on Kalshi, on your phone, free, no login.
Why Build Your Own NFL DFS Projections?
If you have wondered how to make NFL projections without a six-figure data budget, the honest answer is that the math is simple and the discipline is not. You can buy elite NFL projections for the price of a subscription, and many winning players do exactly that. So why learn the build? Because the number is only as good as the assumption underneath it, and assumptions break every week. A projection sheet that still has a receiver at a 24% target share after his team's WR1 was ruled out is wrong, and the person who understands the chain catches it while everyone else rosters a stale number.
The number that quietly wrecks most homemade NFL projections is not a fancy efficiency stat. It is a volume input that nobody updated after an inactive report dropped. Keep that in mind, because it is the thread that runs through every step below. We will come back to it.
Start With Opportunity: Volume Comes First
Football scoring follows the ball. A mediocre running back who gets 22 touches will out-score an efficient one who gets eight, every time. So the foundation of any NFL projection is opportunity, and you estimate it in this order:
- Target Share And Air Yards (aDOT). A receiver's slice of his team's targets is his floor; his average depth of target is his ceiling. A 28% target share is a top-of-the-slate anchor. High aDOT means big-play and touchdown upside; low aDOT means a PPR-safe catch-the-ball floor. Our NFL DFS wide receiver strategy guide goes deeper on turning those two numbers into a roster decision.
- Snap Share And Route Participation. Before you trust a target share, confirm the player is even on the field on passing downs. A route participation above 85% separates a real target earner from a rotational body who happened to catch two passes last week.
- Rush Attempts And Red-Zone Work. For backs, project carries first, then layer the touchdown equity: carries inside the 10-yard line are where anytime-touchdown value lives. A back with 3-plus inside-the-10 carries a game has scoring equity a 4.5-yards-per-carry average will never show. The NFL DFS running back strategy guide builds a full projection framework around exactly this workload layer.
Estimate each of these as a range, not a single number, and lean on a player's last four to six games far more than his season line. Volume is sticky, but it moves with roles, and roles change.
Layer In Efficiency: How Good They Are With It
Once you have volume, you multiply it by quality. This is the step where public advanced stats earn their keep:
- Yards Per Route Run (YPRR) is the cleanest "is this receiver good per opportunity" number. Anything above 2.0 YPRR is strong.
- Yards Per Carry And Success Rate tell you whether a back turns his volume into yardage or just piles up carries. Success rate (the share of plays that stay on schedule) is the floor signal.
- EPA Per Play is the cleanest one-number passing-quality stat for a quarterback. Raw season EPA still counts garbage-time snaps, so for a blowout-heavy schedule use a neutral-script or early-down cut of it rather than the season average when you project a QB.
Two practitioner notes before you multiply. Efficiency regresses far harder than volume: a back averaging 5.2 yards per carry on 60 carries should be projected closer to the position's norm, while a 25% target share is a role, and roles persist. And touchdown rate is the noisiest efficiency input in football, so project scoring from red-zone and inside-the-10 usage rather than last season's touchdown total, or one lucky stretch will inflate every number downstream.
Now multiply your volume estimate by a realistic efficiency rate. Sixteen carries at 4.4 yards per carry is about 70 rushing yards. Four targets at a 72% catch rate is roughly three catches. You are not predicting the exact box score. You are building the median outcome, which is exactly what a projection is supposed to be.
Check The Matchup: Who They Are Facing
A volume-times-efficiency estimate assumes an average opponent, and no opponent is average, so the third layer bends the number toward the defense actually on the schedule. Start with the headline unit stat: opponent defense by EPA or DVOA tells you whether the whole passing or rushing plan gets easier or harder this week. Then check the scheme, because separators beat man coverage while possession receivers feast on zone, and a target share is worth more against the coverage that suits the player's route tree. Position-specific leaks matter most at tight end, where a handful of defenses bleed production to the position all season. For a quarterback, add the trenches: the pressure his offensive line allows against the pressure the defense generates decides whether the EPA number you just used gets a clean pocket to show up in. Keep every adjustment modest. A matchup nudges a projection; it does not double it, and the biggest lever is still the one that comes next.
Anchor Scoring Expectation To Vegas
Individual stat estimates need a team-level ceiling, and Vegas gives you the best one for free. Take the game total and the spread and back out each team's implied team total:
- Implied total = (game total ÷ 2) + (spread ÷ 2) for the favorite, minus for the underdog.
- A 47-point game with a 3-point favorite implies about 25 points for the favorite and 22 for the dog.
An offense with a 27-plus implied total is being handed more chances at points than one sitting at 17, and every skill player on it inherits that. This is the single biggest scoring lever in your model, so anchor to it before you fine-tune anything. Pace matters too: a fast, no-huddle offense runs more plays, and more plays inflate everyone's volume.
Game Script And Injuries: The Multiplier
Now the input that trips everyone up. Vegas does not just set a total, it implies a game script, and script decides whose volume shows up:
- Trailing Teams Pass. A big underdog throws more than its season rate, which boosts pass-catcher volume and hurts the running back's carries.
- Leading Teams Run. A back on a 10-point favorite gains fourth-quarter carries and loses passing-down work; project the closing script, not the season average.
And here is the callback. Remember the volume input that quietly breaks projections? This is where it lives. Always check the inactive report before you lock a number. A WR1 ruled out does not just remove one player; it redistributes 25% of a team's targets to whoever is next in line, and that next man's projection should spike accordingly. An offensive lineman out spikes the pressure the quarterback faces and tanks the whole passing floor. The stat line you started with is only as current as the injury news you checked against it.
Where To Get Free NFL Data
You can build every layer above without paying a cent:
- Nflverse / nflfastR (public, no key) is the backbone for EPA, success rate, air yards, and play-by-play. Pull weekly usage from its
load_player_stats()table (targets, carries, air yards) and snap counts fromload_snap_counts(); those two tables give you the entire opportunity layer without a paid subscription. - Public Weekly Stat Tables (ESPN, nflverse weekly exports) give you snap share, target share, rush attempts, and current rosters. When two sources disagree on a role, weight the one that reflects the most recent game, because a Week 3 snap share tells you more than a season average that includes a since-changed depth chart. One triage note from building these weekly: snap counts are official and free everywhere, but route participation is charted data that often is not, so when you cannot get routes free, approximate with snap share on passing downs before you trust any target-share read.
- Vegas Lines from any odds screen give you totals and spreads, which is all you need for implied team totals.
- Weather Reports for outdoor games. Wind over 15 mph meaningfully suppresses the passing and kicking game, so fade passing projections and lean into the run in high wind.
Note the honest caveat: NFL advanced stats are not yet wired into every public projection tool as deeply as they are for some other sports. When a licensed figure like YPRR is not in front of you, make the point qualitatively (a target hog facing a bottom-five pass defense) rather than inventing a number. A projection built on a made-up stat is worse than no projection at all.
Convert To DraftKings And FanDuel Points (Worked Example)
Now turn the stat line into fantasy points. The two main sites score differently, which is why a player can be a better DraftKings play than a FanDuel play on the same slate. The core scoring rules:
| Category | DraftKings | FanDuel |
|---|---|---|
| Receptions | 1.0 (full PPR) | 0.5 (half PPR) |
| Rush / Rec Yards | 0.1 per yard | 0.1 per yard |
| Rush / Rec TD | 6 | 6 |
| 100-Yard Rush/Rec Bonus | +3 | none |
| Fumble Lost | -1 | -2 |
The table covers rushing and receiving, which is what the worked example needs; passing has its own per-yard and per-touchdown rates on both sites, so check them before you convert a quarterback. Take a three-down back you have projected at 16 carries, 70 rushing yards, three catches on four targets for 22 receiving yards, and a 55% chance to score:
- Rushing Yards: 70 × 0.1 = 7.0
- Receiving Yards: 22 × 0.1 = 2.2
- Receptions (DK): 3 × 1.0 = 3.0 | (FD): 3 × 0.5 = 1.5
- Touchdown Equity: 0.55 × 6 = 3.3
- DraftKings Projection: about 15.5 points
- FanDuel Projection: about 14.0 points
The interesting row here is the reception line. That 1.5-point gap is entirely receptions, which is why pass-catching backs and high-volume receivers are worth more on DraftKings' full PPR, while touchdown-dependent, low-catch players close the gap on FanDuel. Understanding that split is half of what separates a good DraftKings vs FanDuel NFL DFS roster decision from a coin flip.
Turn The Projection Into Value: Points Per Dollar
A projection on its own is still only half a decision, because DFS is a salary-cap game and the site has already priced your player. The bridge between the two is value: projected points per $1,000 of salary. Say the site prices that same back at $6,800 on DraftKings. His 15.5-point projection works out to about 2.3 points per $1,000. The rough screening bar most players use is 3x, so at that price he needs roughly 20 points to pay off, and your projection says his median is well short of it.
That is not a reason to cross him off. It is a reason to know what you are buying: at $6,800 he is a floor piece, not a slate-breaker, and the same 15.5-point projection attached to a $5,000 price tag would be a standout raw value at that price. This is why building the projection yourself matters more than the final number. When you know the median came from 16 carries and a 55% touchdown chance, you also know which lever (a bumped-up carry count from a blowout script, or vulture-proof goal-line work) would push him from 2.3x toward 3x, and whether this week's matchup actually pulls that lever.
Do the work once, then let the Sims do it thousands of times over. Code NFLPROJ10 takes 10% off the same NFL projections our analysts run, plus the simulation engine that turns them into lineups.
Sanity-Check Against The Stokastic Sims
Building your own projections is the best way to learn the sport. It is not the fastest way to a winning lineup on a Sunday with 13 games. So the final step is calibration: line your homemade number up against the Stokastic Sims, and the NFL DFS projections, ownership and stacks in the DataHub are the fastest place to run that comparison side by side.
Inside Stokastic Sims, the tool surfaces each player's median projection alongside projected ownership, which is exactly what a homemade sheet cannot do on its own. That second column changes the decision: the 15.5-point back from our worked example at 25% projected ownership is a very different tournament play than the same number at 8%, because the field has already priced one of them in. Where you and the model agree, you can roster with conviction. Where you disagree, one of two things is true: either you caught an injury or role change the market has not fully priced, which is a real edge, or your input is stale, which the callback above warned you about. Either way, the disagreement is the useful signal. From there, our Sims vs. optimizers breakdown covers how to build lineups around your projections, and layering in ownership turns a good projection into a leverage play, the way we lay out in our NFL DFS stacking breakdown. Projections tell you who is good; the Sims and ownership tell you who is good and under-rostered, and that combination is what wins tournaments.
If you want the broader roadmap once your projections are dialed in, our NFL DFS strategy guide and the sport-agnostic how to make DFS projections primer are the next two reads.
FAQ
What is the most important stat for NFL DFS projections? Opportunity, specifically volume. Target share and snap share for pass-catchers, rush attempts and red-zone touches for backs. Volume comes before efficiency because a high-volume role survives a bad game, while an efficient player with no volume has no floor.
How do I find a team's implied total for a projection? Split the game total in half, then add half the spread for the favorite or subtract it for the dog. A 48-point game with a 4-point favorite implies roughly 26 points for the favorite and 22 for the underdog. That implied total is your scoring anchor for every skill player on the offense.
Can I make NFL DFS projections for free? Yes. nflverse and nflfastR give you EPA, air yards, and play-by-play with no key; public weekly tables give you snap and target share; and any odds screen gives you totals and spreads. The hard thing to get free is a tournament-grade simulation engine, which is where the Stokastic Sims come in.
Do DraftKings and FanDuel projections differ? They do. DraftKings is full PPR with a 100-yard yardage bonus; FanDuel is half PPR with no bonus and a larger fumble penalty. The same player is often worth 1 to 2 more points on DraftKings if he catches passes, so project each site separately.
The Bottom Line
An NFL projection is not a prediction of the future. It is a disciplined estimate of the median, built in order: volume, then efficiency, then matchup, then the game environment, then a last check against injuries and script. Get the order right and the arithmetic is simple. Get the volume input current and you are already ahead of most of the field, because the biggest projection mistakes are never math errors, they are stale roles. Build the chain yourself, check it against the Sims, and you will not just have a number on Sunday. You will know exactly why it is the number, and which part of it to trust.
Do the build once yourself, then let the Sims pressure-test it every week. Code NFLPROJ10 takes 10% off Stokastic NFL Sims and projections.
More on this: NFL DFS Hub: Every Live Stokastic NFL Page · How To Make DFS Projections · NFL Win Projections 2026: The Teams That Moved Before Week 1 · NFL DFS Late Swap: How To Use Late Games To Win GPPs · NFL Week 1 DFS Injury Updates: Jeanty, Kamara & The Raiders Chalk Question
Stokastic Sims + NFL Projections — build the chain yourself, then check it against the projections built for tournament leverage
Use code NFLPROJ10
Get Started