I dream of fantasy sites with apps like Tinder, where you swipe left and right to find head-to-head matches; then, both people in each game will be willing participants. But until that time, you have two choices for 1 on 1 action: post a game and play whoever wants to join or pick from a long list of pros in the lobby. However, we’re here to discuss how to select the right MLB head to head opponents, so let’s get going.
Posting a head to head on DraftKings or FanDuel is a little bit like being a girl on Tinder in terms of how many people want to match with you. (At least that’s what I hear about Tinder; I’ve never posted a catfish account.) Even when you’re the #1 player, there are still other DFS professionals willing to take your games.
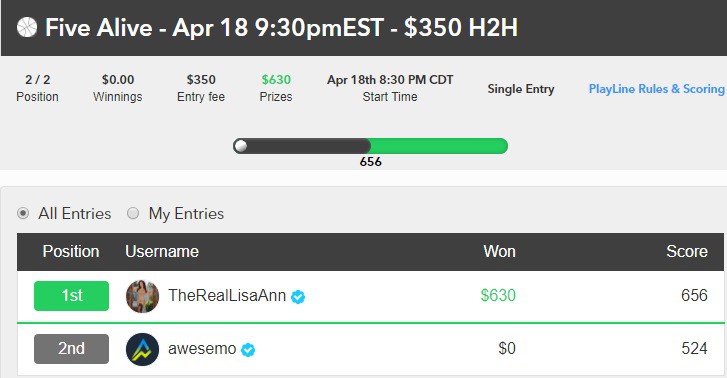
One time I posted an MLB head to head on PlayLine and Lisa Ann (former porn star turned SiriusXM fantasy sports radio host) joined it, so that made wading through all of the other pros worth it. Lisa dominated me, but that in itself fulfilled a lifelong dream.
To be profitable in head to heads, you need to win at least 10/18 or 55.6% of your games to overcome the standard 10% rake. But looking at your overall head-to-head track record isn’t enough. To maximize profitability you don’t just want to consider whether to play head to heads, you need to discern whom to play against. One option is racking up games against an individual and tracking your success in a spreadsheet. After a few hundred games you should have an adequate sample size to determine whether it’s a profitable match-up. But that can get very expensive very quickly.
My preferred approach is to avoid the thousands of dollars of entry fees and to use a little math instead. Play an opponent five to ten times at low stakes and each time use your own fantasy-point projections to determine the projected total score for your lineup versus the projected total score for your opponents lineup. Based on the average difference in projected scores you can determine whether playing that opponent is a profitable endeavor.
As an example, I used my historical contest data to determine that (1) the standard deviation of my MLB lineups on DraftKings is approximately 30 points and (2) the deviations between the actual and expected performance of my lineups follow a normal distribution. Using these inputs I simulated the chance of winning a head-to-head contest based on the difference in projected score of the two competing lineups. The results are summarized in the table below.
[table id=689 /]
This shows that to be profitable I need an advantage of 6 points in a $10 contest and 3.5 points in a $1,060 contest (where the rake is only 6%). If I’ve determined after five to ten matchups that my lineups are projected on average at less than 6 points over my opponent’s lineup’s projection, I will stop playing that person at the $10 level. And if my lineup’s projection is not 3.5 better than my opponent’s projection on average, I’ll avoid that person entirely.
The above example, of course, assumes that the two lineups (mine and my opponent’s) are independent variables, but that’s not usually the case, particularly on smaller slates where most cash lineups have significant overlap. When overlap is expected, the calculation changes. Let’s take the extreme example where two lineups completely overlap except for one player; e.g. I have Mike Trout and my opponent has Bryce Harper. Using Trout and Harper’s standard deviations and assuming their fantasy point performance falls along a normal distribution (a good but not perfect fit since batters cannot receive negative fantasy points), I approximated the following solution:
[table id=690 /]
In short, the table shows you need a 1.75 points advantage with Trout to break even at $10, and 1 point to break even at $1060. So if you project Trout for 11.5 fpts and Harper for 10 fpts (and your projections are relatively accurate), you should expect on average to break even, while your opponent will have -20% ROI.
But concluding that it’s easier to be profitable in smaller slates/high-overlap situations because the required edge is only 1.75 points versus 6 points would be an error. The 1.75 point represents approximately 15% of Trout’s or Harper’s projection, while the 6-point advantage required in no overlap situation represents only about 6% of the total lineup projection. In other words, the extreme overlap scenario requires you to outperform your opponents picks by 15%, while no overlap requires you to only outperform his picks by 6%.
The margin of error in targeting good players in heads to heads is small. No one’s projections are perfect including yours; otherwise, you’d be the #1 player. Using your projections, keep track of your opponent’s projected score versus yours; it’s a much better indicator of future success against that opponent than a small sample size of actual scores. Since your lineup is going to be the highest projection in your model, you also have to have more margin than what’s listed above due to projection error.
With good game selection, MLB head to heads can be the steadiest way to build your bankroll. Since there’s not much correlation between head to heads on a single slate, unlike double ups which all have similar cash lines, you can take greater risks with your bankroll, especially if you have a significant advantage over your opponent. Avoid playing against tough competition by selecting the right opponents and blocking tough ones, and you should see your results improve dramatically.