The field is set for Sunday’s 51st Daytona 500. However, before we get into NASCAR DFS picks for Sunday’s race (coming Saturday), we need to preview a few things that will ultimately affect your lineup decisions. You probably feel pretty secure in your NASCAR DFS choices Sunday. Yet, for some of you, this may be your first time submitting a NASCAR DFS lineup. Thus, whether you are experienced or novice, I present the following preview of Daytona, this individual race and what lineups should look like.
You only have one more day to get the Awesemo NASCAR package for just $129.95 by using promo code “NASCAR2020” at checkout. After Feb. 15, the price jumps back up to $229.95, so grab this deep discount before it’s over!
Daytona International Speedway
Daytona is a 2.5-mile tri-oval that falls into the category of “superspeedway.” Besides its length, only matched by Talladega Speedway, the other distinguishing feature of Daytona is its banking. In the tri-oval area (the front-stretch), the banking sits at 18 degrees. However, in the corners, the banking goes all the way up to 31 degrees. When you combine length and banking, you ultimately end up with speed. In fact, speed actually became a safety hazard. Bill Elliott set the track record in 1987 when he posted a qualifying lap of 210.364 mph. Soon afterward, NASCAR implemented restrictor plates on carburetors to knock this speed down considerably. We’ll delve more into those carburetors later.
Daytona 500
For as long as NASCAR has existed in the form we know and love, the Daytona 500 has always been the inaugural race of each season. To some, it seems foolish for NASCAR to start their year with what most would consider the sport’s Super Bowl. It’s akin to a new band starting their set with the only radio hit they have. However, with the history of Daytona, NASCAR couldn’t envision any other way to start the new season.
In fact, the week leading up to the Daytona 500 has become such a spectacle that drivers are essentially forced to qualify twice. First, last Sunday was a traditional timed single-lap that set the front row. Then, as you may have watched yesterday, the prospective field is split into two fields (Duels) and made to race again so as to set the actual starting positions. When you combine the Duels with qualifying and The Busch Clash last Sunday, nearly half the field will have turned 140-plus laps before the green flag is ever dropped.
As to the race itself, the Daytona 500 is one of the crown jewels of the NASCAR Cup Series. Not only does winning the 500 immortalize you in the record books, it helps strengthen shaky Hall of Fame cases, guarantees you a spot in the playoffs and gives instant notoriety as drivers visit every morning show from ABC to ZBC.
Plate Racing
Let’s get back to carburetors. When NASCAR introduced restrictor plates for superspeedway races, they had an unintentional consequence. By cutting down the available air flowing into the carburetors, they essentially leveled out the field. In the 1980s, stock cars still resembled a “stock car”. However, in the years to follow, cars slowly became the same composite body with just different stickers thrown on the front and rears. With the restrictor plates, not only were the car chassis basically the same, but so were the engines. Outside of small adjustments like tape, wedge, etc., no car is really different than any other.
So what happens when you put a pack of 40 cars together that are all capable of running the same max speed at a superspeedway? You end up with a race where anyone can pass anyone. You end up with a race where drivers can gain or lose multiple positions in just one lap. Also, since drivers are running mere inches, or even centimeters apart from one another, you can see half the field removed with a single wreck.
This all combines to create a highly volatile race. Perhaps this helps explain the grandeur of the Daytona 500 even further. Anyone can win like a young Trevor Bayne making his first career Cup start in 2012 for the lowly funded Wood Brothers team. Furthermore, at any moment the “Big One” can strike, resetting the entire race.
Examing Daytona 500 Finishes, 17-19
One of the newest features of the improved Race Sheets is the start/finish heat map. To further illustrate the above point, let’s dig into that heat map and see where drivers are finishing relative to their starting position.
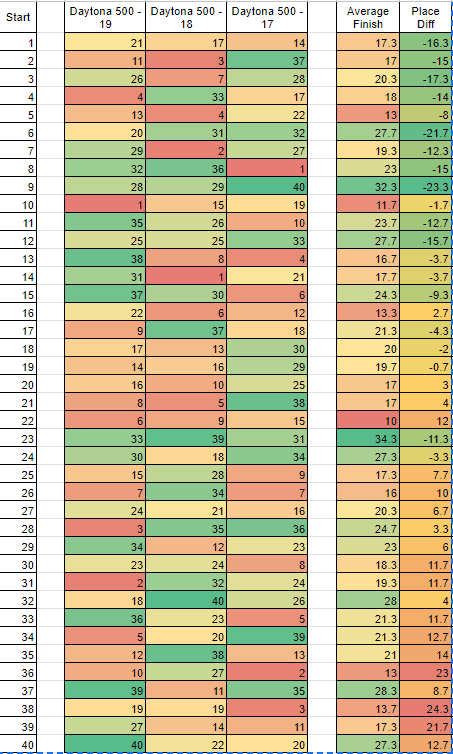 In the graph, you’ll see the starting position where that driver finished in each of the past three Daytona 500 races and the corresponding averages. Note how drivers starting 1-12, on average, lose eight or more spots from start to finish, save for 10th place. However, even that driver went negative in two of three races. On the polar end, if you scroll down to the drivers starting 30th or worse, nearly all of them are gaining eight or more spots. It’s a peculiar dance of drivers upfront falling back while drivers in the rear move upwards.
Let’s take this a step further. Drivers 1-10 finished in the top five just six of 30 times in our data set. Scroll down to drivers 30-40 and you find nearly as many top-fives with five. If we pan out a little further for top-10s, then we see six top-10 finishes for the first 10 starters. If we move back down to 30-40, we have the exact same number of top-10s.
Let’s focus our aim on the best average finish. You have to scroll all the way down to the driver starting 22nd before you find the best average finish (10th). The next two starters are reasonable with 10th (11.7) and fifth (13). However, two of the next three best average starters come from 36th (13) and 38th (13.7). If you look at the top-10 average starting positions in terms of best average finish, only two came from the top-10 starters. If you gaze out to the top-20 starters, just five came from the top 10.
Here are some more numbers to chew on when you average out the starting positions of the top five, 10, 15 and 20:
Top-five average starting position – 17.8
Top-10 average starting position – 18.8
Top-15 average starting position – 19.2
Top-20 average starting position – 18.95
Granted, a three-year running average where only three races are the dataset is small. However, if you climb further through past Daytona 500s, you’ll find similar scenarios. And if you expand it to other superspeedway races, you’ll find the same thing.
Daily Fantasy Implications
Thus, if we have a race with lots of passing wherein drivers who start up front have the tendency to fall back and the reverse happens with drivers in the rear, how will that affect DFS lineups?
The answer obviously is quite a bit. Only three other times the whole year will you build lineups like you will this weekend. Coincidentally, they will all be for superspeedway races. As such, if you nail roster construction Sunday, don’t march into next week thinking replicating this process will work for Las Vegas. Just fold this up like a nice note and put it away for Talladega.
We have the four major legs to the table known as NASCAR DFS lineup construction so let’s look and see how each leg gets affected by this race.
Fastest Laps (DraftKings)
Because of the draft and everyone’s cars running the same, fastest laps are a moot point. Generally, fastest laps occur at the front of the field, if not with the leader. However, at superspeedways, they are genuinely random. On lap one they might occur with the fourth car in the second row. A lap later it could be the third to last car in the inside row. Thus, don’t worry about the half-point bonuses. They’ll get earned by whichever random driver runs them.
Laps Run (FanDuel)
FanDuel awards 0.1 points for running a lap. If your driver completes all 200 laps, then they earn 20 points for having run the race. Obviously, you want all five drivers on FanDuel to finish the race. In a normal race, this would make us place extra consideration on punt plays as we want as many laps run points as possible. However, drivers rarely run one or even multiple laps down in superspeedway events. You either crash and end your day or you get taped up and go back out. So just build your lineups on the assumption that all five drivers will finish on the lead lap, like you were planning to do regardless.
Laps Led
While both sites award bonus points for drivers who lead laps, the points are not equal. DraftKings awards a quarter-point bonus for each lap led while FanDuel only awards 0.1 points. Thus, a total of 20 laps led points are available on FanDuel. Meanwhile, that number jumps up to 50 on DraftKings. When you consider how many times the lead will change, those bonus points shrink up rather fast. On average, the driver who has led the most laps at the Daytona 500 dating back to 2013 has led 77 laps. When you convert that into FanDuel bonus points, you get just 7.7 points. On DraftKings, however, that becomes 19.25 points.
Chasing a lap leader, much less two, on FanDuel isn’t worth the 7.7 points. However, garnering an additional 19.25 bonus points on DraftKings seems worth it. Due to the reduction in laps, scores will be lower, therefore getting a 20-point bump could really help bolster one’s day. Yet, there really is no predictability in guessing who out of 40 cars is going to lead laps. Plus, there is no guarantee that the lap leader won’t lose place differential relative to where they started, thus negating those points.
Therefore, for Sunday’s race, I recommend treating laps led like the fastest laps. If they happen, they happen. Don’t try making it a priority in your lineups. If you do, you may end up with too many drivers starting towards the front.
Place Differential
If we’re downplaying fastest laps, laps run and laps led, then what is the priority in fantasy scoring for Daytona? It begins with place differential or the spots drivers gain or lost compared to where they started. Next to finishing place points, this will be the largest factor in how many points a driver earns Sunday. Besides boosting a day, they can be the reason a driver goes negative. Say, for example, Driver X starts fifth but crashes out early and finishes 40th. After losing 35 spots on the track, he loses 35 points on DraftKings and 17.5 on FanDuel. On the flip side, if Driver X starts 38th and ends their day in fourth, those 34 spots gained turned into 34 bonus points on DraftKings and 17 on FanDuel.
Finishing Position
It’s pretty simple: the higher your driver finishes the more points they earn for that finish. DraftKings and FanDuel don’t match exactly how many points each driver earns but it is certainly close. What does matter is that finishing position will be the cornerstone of NASCAR DFS scores.
The Fantasy Ikea Table Assembled
To recap, we’re disregarding laps led, fastest laps and laps run. Instead, we’re placing major emphasis on place differential and final position. This is an unconventional build for an unconventional race.
So when this is all fleshed out, what does this sort of lineup look like?
- The majority of the player pool is going to come from the back half of the field. The only way to get place differential is to use drivers who can actually obtain it. Furthermore, if you refer back to the graph above about where drivers are starting, you see a trend. Whether top five, 10, 15 or 20, the average starting position was coming from the latter teens. Most people like to separate the field around 20th and use drivers from there. However, feel free to move that line up or down a few spots. The further you go up the more risk you take, while going down ensures safety. The higher a driver starts the more place differential he can lose while he has less to gain. Apply the same logic to a driver starting further back.
- Because we’re not concerned about who the driver is, just where they start, you may end up with lots of salary cap left over. When the cars are on a level playing field, it allows us to focus on how much place differential they can gain. Generally, the drivers with the most spots to gain are the cheapest salary-wise.
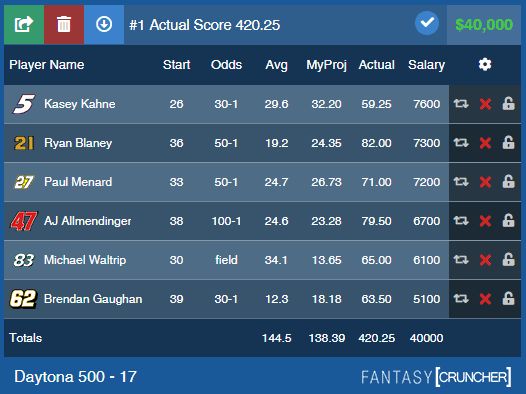
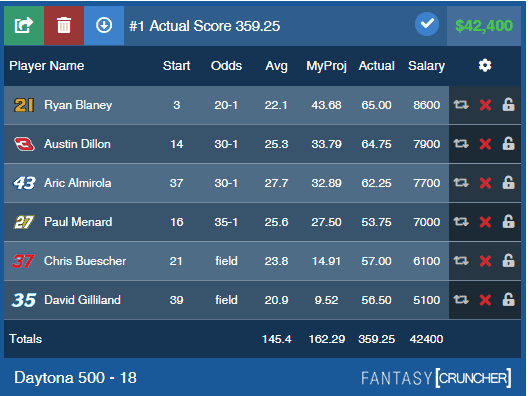
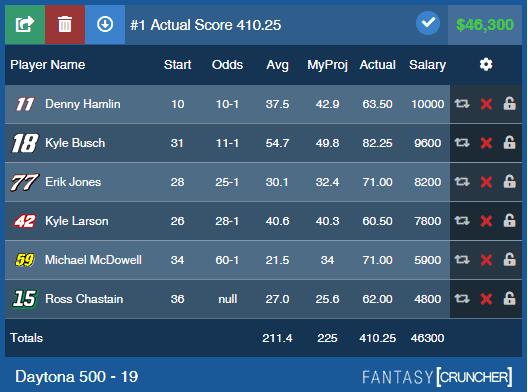
Below are the optimal NASCAR DFS lineups from the past three Daytona 500 races. You will see the above points emphasized in all three rosters. There are lots of drivers starting 20th or worse and lots of salary cap left over.
Be sure to check back later for my top NASCAR DFS picks for the Daytona 500. Good luck with your NASCAR DFS lineups!