The NFL Data Deep Dive goes beyond the box score, looking into the advanced metrics you need to know in order to make informed fantasy football decisions. After games wrap each week, Matt Savoca will visualize and break down the most important numbers in the ever-changing NFL landscape, including proprietary metrics related to efficiency and productivity at the team, quarterback and skill-player level. This is all in preparation for his weekly Matchups column, published every Thursday and available in podcast form every Friday afternoon on the Awesemo Podcast Network. Let’s dig into the data for Week 1 as we look ahead to Week 2 for NFL DFS + Fantasy football
**50% OFF Awesemo+ NFL DFS WEEKLY**
The Fantasy Football season kicks off in full on Sunday, and we’re offering you 50% off the Awesemo+ NFL Weekly Pass by 50% when you use promo code REDZONE. The Weekly Pass gets you access to Awesemo’s leading fantasy points and NFL DFS ownership projections, lineup builder and top stacks tool. Use promo code REDZONE before time runs out on Tuesday, 9/15/20.
For a full list of all our NFL DFS and fantasy football content this season, check out the NFL content schedule.
And don’t forget to join Matt Savoca and Dave Loughran, every Thursday morning at 11 ET on the Awesemo YouTube channel.
Team Efficiency
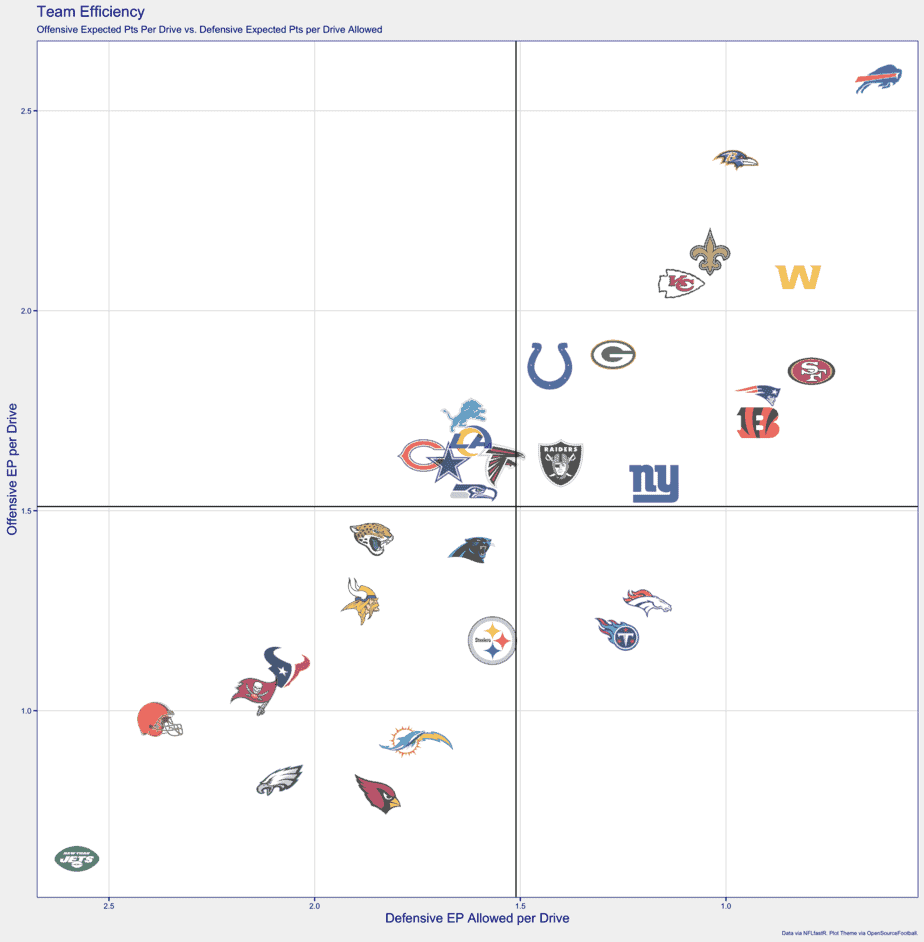
The mighty Bills’ numbers are skewed by drawing the lowly Jets in week one, but Josh Allen was effective and relatively efficient in a game that was out of hand rather quickly. Washington being clustered with perennial playoff teams Baltimore, New Orleans and Kansas City is something exactly zero people expected this time last week, but their upset over the Eagles puts them in this elite efficiency category, at least for now. A few losing teams who appear in the upper right quadrant of the chart, indicators of a strong offense and a strong defense compared to opponents: the 49ers, who clearly have trouble with Kyler Murray, the Bengals, who were a field goal away from overtime, and the Colts, who were shocked by Gardner Minshew and his 95% completion percentage.
Team Aggressiveness
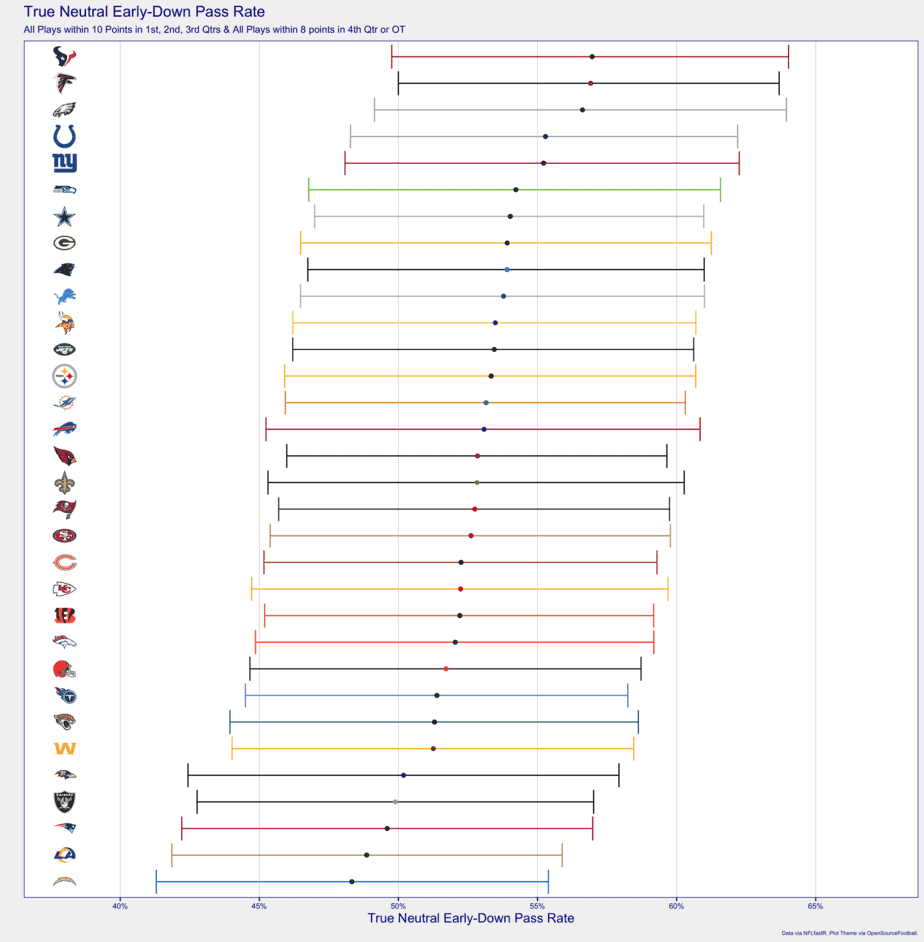
While the Texans (playing against Patrick Mahomes) and Falcons (playing against Russell Wilson) make intuitive situational sense given this graph’s one-week sample, they were teams forced to keep pace with opposing quarterbacks at the top of their game. Indianapolis at No. 3 is certainly a surprise, as their play calling was likely affected by the efficiency of the Jacksonville offense. “Let Russ Cook” truthers will be thrilled to see Seattle’s aggressiveness creep up into the top five. Wilson looked utterly unstoppable in Atlanta. There’s simply no reason for the traditionally conservative Seahawks to limit their quarterback’s attempts to later downs. Those who warned about the Charger’s ultra-run-heavy scheme affecting their skill players’ ability to score fantasy points appear to correct, as they (and their Los Angeles neighbors, the Rams) find themselves in a tier of early-down conservatism all their own.
Quarterback Efficiency
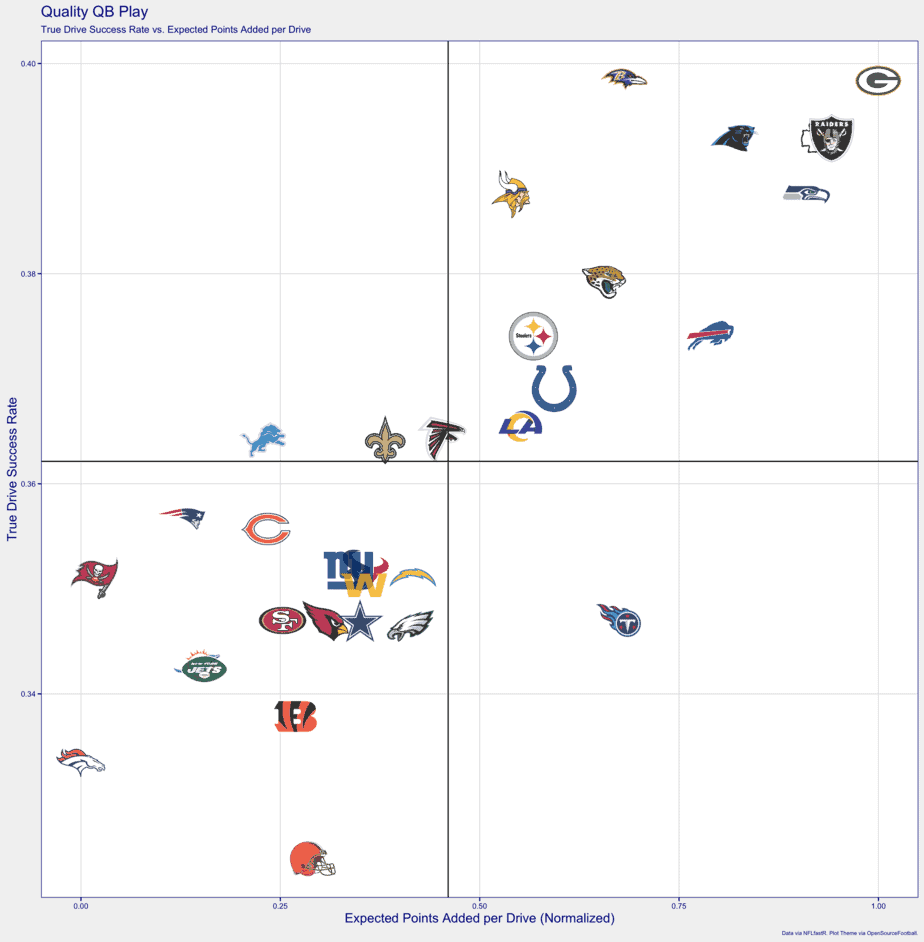
Aaron Rodgers reminded you of his previous status on Sunday, eviscerating the Vikings secondary in a game that was more out of hand than the final score indicates. Patrick Mahomes, Russell Wilson and Lamar Jackson float toward the top-right of the chart as well, indicating they’re starting right where they left off in 2019. Two surprise names in the top tier alongside the big four are Derek Carr and Teddy Bridgewater, who went up against each other this Sunday. Part of their high rankings without a doubt has to do with both the Raiders’ and Panthers’ defenses to be considered sub-par. Time will tell if Carr and Bridgewater are for real in these metrics or if they are boosted by their schedules. Some notable names who performed poorly in both metrics include both 2018 and 2020 No. 1 overall picks, Baker Mayfield and Joe Burrow, who square off in two days’ time on Thursday Night Football, and Tom Brady, who appeared out of sorts on film. This perception is backed by low showings in both efficiency metrics in the chart, putting him on par with Ryan Fitzpatrick and Sam Darnold.
Skill-Player Opportunities for NFL DFS
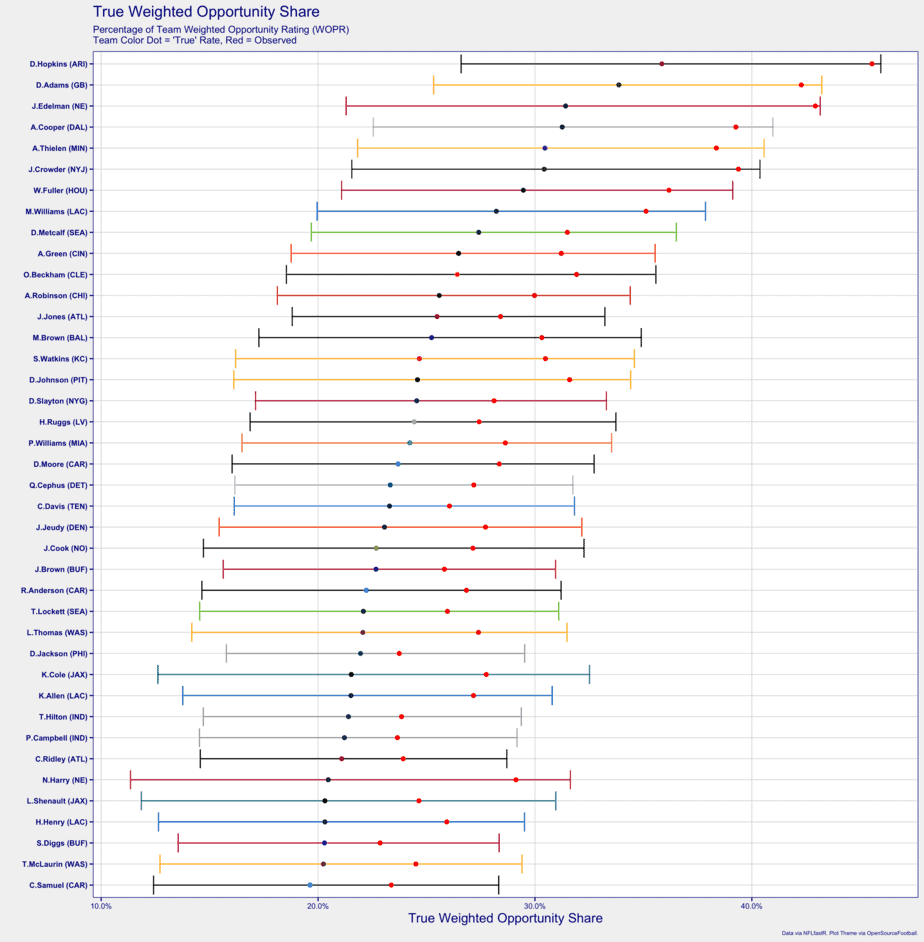
So much for the air raid offense spreading the ball amongst its play makers. DeAndre Hopkins was back to commanding his normal, unfathomably high workload in his first game as a Cardinal, only matched by fellow stud wideout Davante Adams, who led the week in raw targets. Julian Edelman and Amari Cooper make surprise appearances towards the top of this list, as their days were much less effective than those below them, Adam Thielen, Will Fuller and Jamison Crowder. It’s only one game, but the Chargers appear ready to deploy Mike Williams as an alpha receiver, to the detriment of Keenan Allen, while Henry Ruggs earned the top score among rookies, even while exiting briefly with a leg injury. The next-best rookie: Fifth-rounder Quintez Cephus, who got a shoutout in the matchups column last week as a player to watch. The Kenny Golladay injury may have accelerated his ascent. No Michael Thomas in the top 40 is jarring, but again, it’s just one week.
High-Value Opportunities
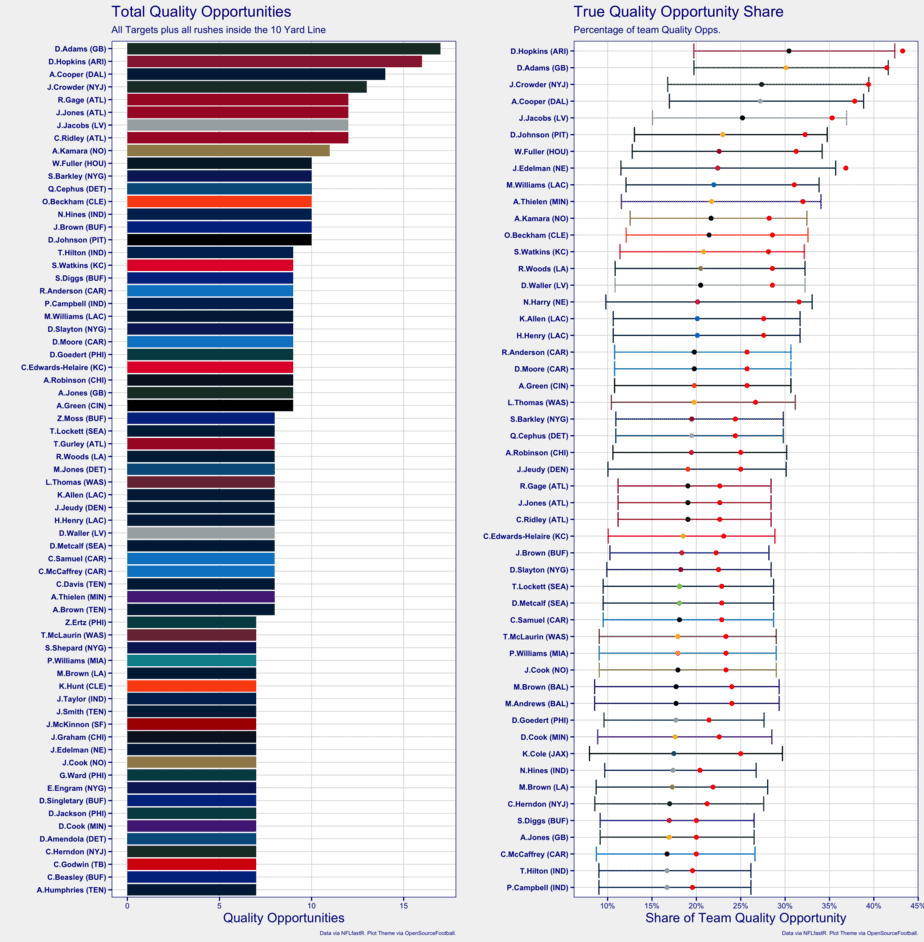
Things don’t get wacky on this chart until the fourth line. I, for one, thought Jamison Crowder would be a solid high-floor, volume-target play against the Bills, but he ended up commanding an elite number of valuable looks from Sam Darnold. Matt Ryan used three weapons interchangeably Sunday. The first two, Julio Jones and Calvin Ridley, are to be expected, but the heavy usage of Russell Gage comes as a major surprise. Many had penciled in Hayden Hurst for the No. 3 receiver role, but at least in Week 1, the tertiary option in the pass-happy Atlanta offense appears to be Gage. Josh Jacobs, Alvin Kamara and Nyheim Hines are the top running backs on the list, most notable because the latter two, particularly Hines, are known as pass-catching running backs but saw multiple goal-line looks. Needless to say, if a pass-catching back is also getting looks near the end zone, their fantasy upside week-to-week is through the roof. Jonathan Taylor (six Quality Opportunities) should see that number skyrocket after the Marlon Mack injury, as should Clyde Edwards-Helaire, who still appears smack in the middle of this list without earning a single target. Logan Thomas, the Washington tight end, along with the aforementioned Cephus, are the most surprising names in the top 20, commanding nearly a fifth of their team’s quality opportunities.
Condensed Passing Offenses for NFL DFS Stacks
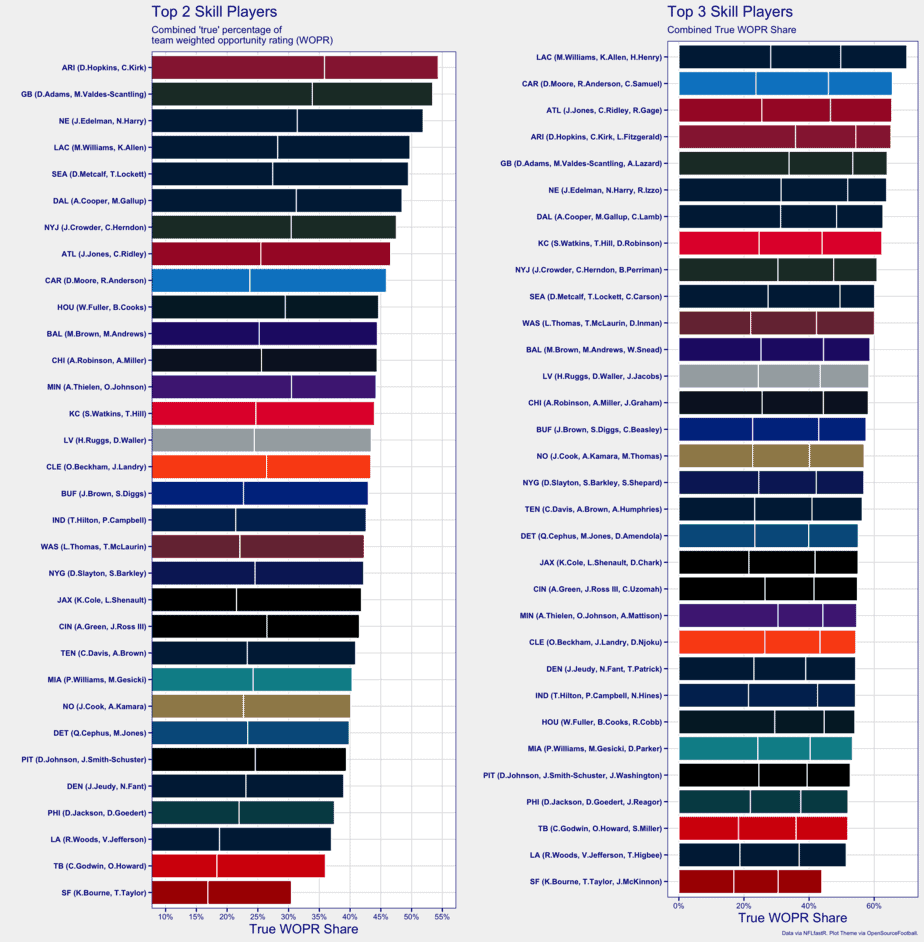
Things get weird right after the first line. While it’s no surprise that Davante Adams was his typical target hog, the emergence of Marquez Valdes-Scantling as a deep threat could drastically impact the Green Bay passing attack for the better. They, along with Arizona and relative-surprise New England, are the only teams who condense 50% of their weighted opportunity share to just two players. For the Panthers, D.J. Moore saw much more opportunity than his final stat line indicated, while it was Robby Anderson who was used effectively beyond his 75-yard touchdown catch-and-run. In fact, combining both Moore and Anderson with Curtis Samuel’s usage captures over 61% of the entire Carolina passing game, No. 2 amongst all teams in Week 1. Early indications in Tampa are that Tom Brady may spread the ball around more than fantasy players may like. Mike Evans was blanked for most of the game but ended up finding the end zone. Despite this, O.J. Howard emerged as the player most heavily used beyond Chris Godwin. The 49ers, hobbled by a slew of receiver injuries and now an injury to all-world tight end George Kittle, understandably spread the ball around in Week 1. Part of this can be explained away by scheme, and Jerick McKinnon’s usage as both a rusher and receiver is notable, but at the moment the former NFC champs appear depleted of play makers heading into Week 2.
Bell Cow Backs
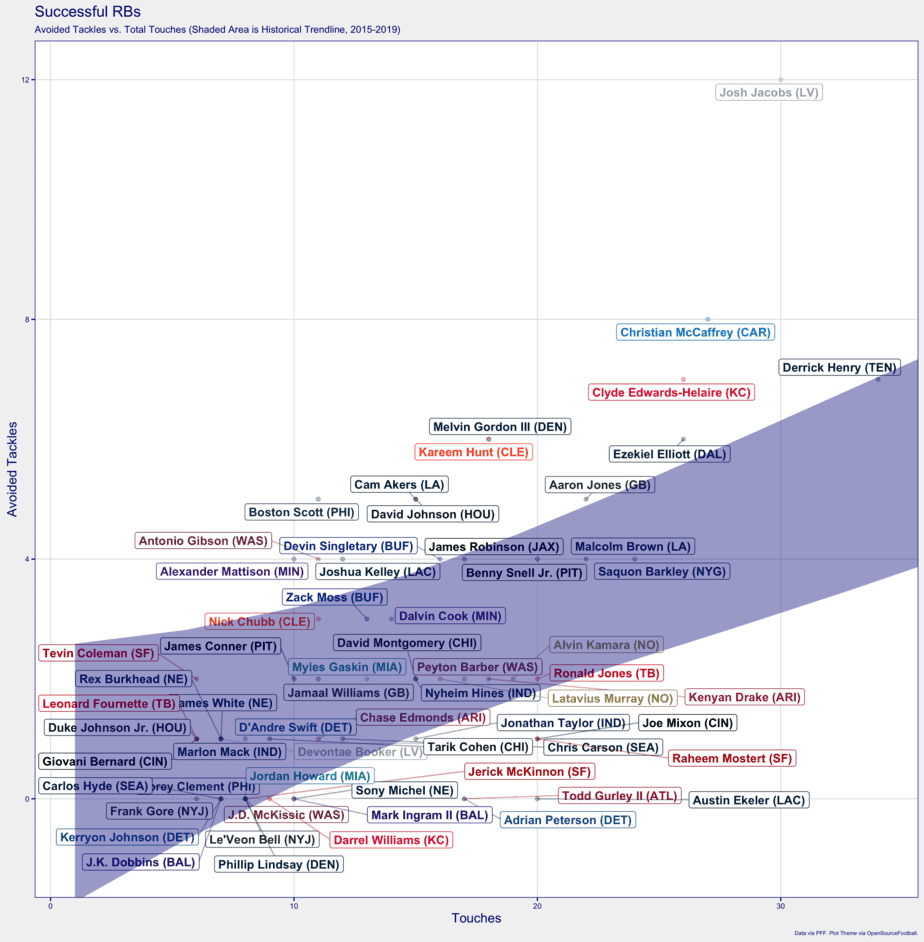
Ball out, Josh Jacobs. Yes, we expect the Panthers defense to be historically ineffective this season, but the largest workload and the most avoided tackles is absolutely nothing to scoff at. Christian McCaffrey appeared every bit as effective to begin the season, as did Ezekiel Elliott. Most encouraging, however, is Clyde Edwards-Helaire, who’s shiftiness translated to the NFL seamlessly in his first game. He appears to already be in the top tier of running backs right out of the gate. Fellow rookies Cam Akers and Antonio Gibson, while disappointing for those that played them last week, were effective with their touches, which are positive indicators for future efficiency if their volume were to increase. Kareem Hunt and David Johnson both played like their former selves last week, as they were both quite elusive on middle-of-the-road volume. When you consider Austin Ekeler had one catch and avoided zero tackles, his 84 yards on the ground seems like the floor for him despite coach Anthony Lynn indicating targets to Ekeler could decrease due to schematic changes.
Follow us on all of our social channels! Check out our Twitter, Facebook, Instagram and YouTube for more great Awesemo content.
Looking for more NFL DFS picks + Fantasy football content? We’ve got loads of articles, data, cheatsheets and more on the Awesemo NFL home page, just click HERE.