
DraftKings MMA DFS Cheat Sheet: Sims, Projections And Ownership
By Sam Smith
August 7, 2026

Stokastic's free MMA DFS cheat sheet is six small tables that condense tens of thousands of fight simulations into a two-minute read, and Saturday's UFC Fight Night: Gamrot vs. Salkilld card at the UFC APEX in Las Vegas is the right slate to learn it on. One fighter, main-event lightweight Quillan Salkilld, sits first on four of the six panels at once: value, ownership, top-150 exposure and leverage. That almost never happens, and understanding why it happened this week teaches you how every panel connects to the others. By the end I will take Salkilld's row and walk it into the spine of a six-fighter DraftKings roster under the $50,000 cap.
The Quick Answer
The DraftKings MMA DFS cheat sheet is a free per-card board built from a full Stokastic Sims run, split into six panels: salaries, projections, ownership, value, top-150 exposure and leverage. Read the projection and value panels to find the fighters worth rostering, then read the ownership and leverage panels to decide which of them your tournament lineups should actually lean on. The panel-by-panel breakdown, the five-round main-event math, and a worked example that turns Salkilld's row into a full roster are all below.
What The MMA DFS Cheat Sheet Is
The cheat sheet is the free per-card summary of what the paid Stokastic Sims produce for a UFC slate. The Sims fight the card tens of thousands of times, assemble a pool of lineups from those outcomes, rank that pool by simulated ROI, and the sheet skims the top of the output into six panels.
The sheet itself costs nothing, every card, no package required, and no promo code touches it because there is nothing to discount. The code below applies to the paid Stokastic DFS packages behind the sheet, where the full MMA Sims, fighter projections, Ownership Projections and the ROI-ranked lineup pool live. Code ALL15 takes 15% off the first payment on a Stokastic DFS package.
This week's edition covers Saturday, August 8, and the loudest story on the board is the fighter the salary panel misses: the projection panel's No. 2 never appears among the five biggest salaries. Hold that thought; it pays off two sections from now.
The Six Panels And How To Read Each One
| Panel | What the number is | How I act on it |
|---|---|---|
| Highest Salaries | The most expensive fighters on the slate | Where the cap fight starts, not a quality ranking |
| Top Projections (Proj FP) | Median projected DraftKings fantasy points | The pecking order for my lineup's anchor slots |
| Highest Ownership (Own%) | Projected field ownership | Where the field will be, not where I should be |
| Top Values (Value) | Projected points per $1K of salary | The fighters who fund the rest of the roster |
| Top Exposures (Exp%) | Top-150 exposure: how often a fighter appears in the 150 highest sim-ROI lineups | The Sims' actual shopping list |
| Leverage Plays (Lev%) | The gap between optimal exposure and field ownership | Where tournament edge comes from |
Six fighters under a $50,000 cap, no positions, and scoring so top-heavy that a losing fighter barely scores: that is DraftKings MMA in one sentence. Salary allocation is the whole game, and every panel on the sheet is one input into that allocation. Here is what each panel says this week.
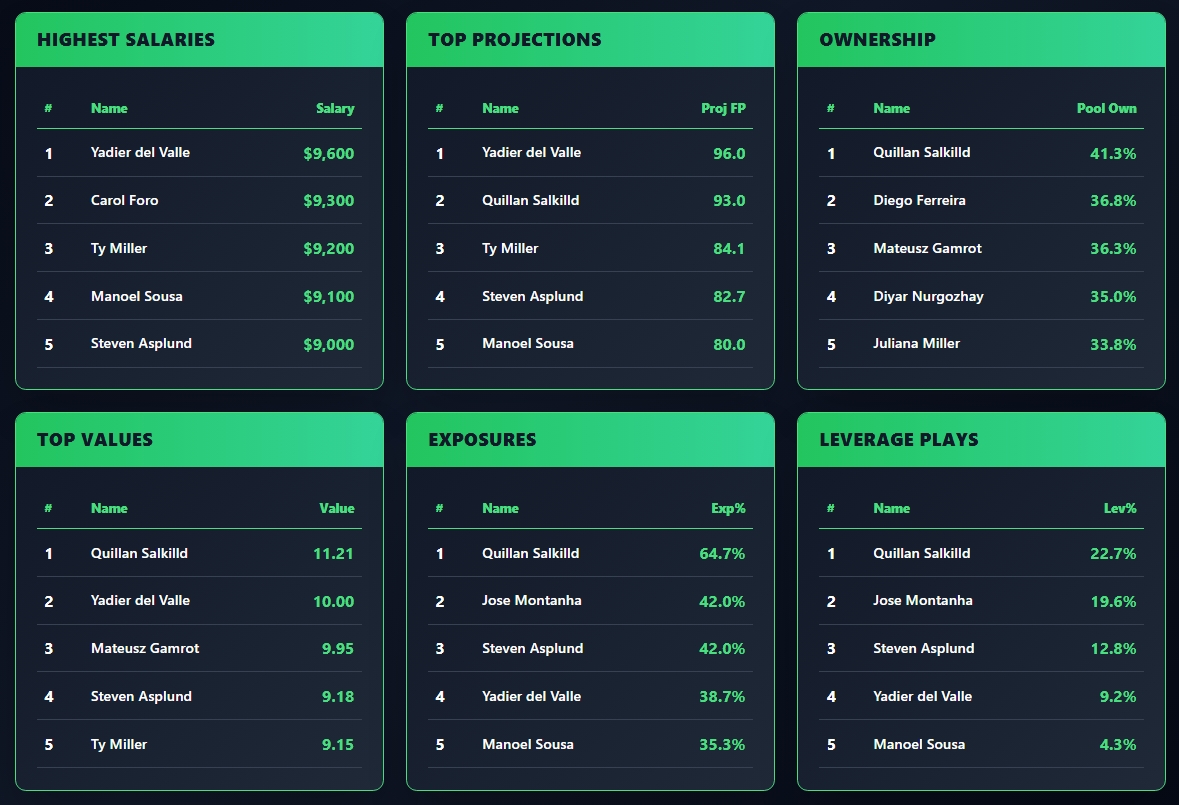
Where salaries and projections disagree is the slate. The five biggest salaries belong to Yadier del Valle ($9,600), Carol Foro ($9,300), Ty Miller ($9,200), Manoel Sousa ($9,100) and Steven Asplund ($9,000). The projection panel only partly agrees:
| Top Projections | Proj FP | Top Values | Value |
|---|---|---|---|
| Yadier Del Valle | 96.0 | Quillan Salkilld | 11.21 |
| Quillan Salkilld | 93.0 | Yadier del Valle | 10.00 |
| Ty Miller | 84.1 | Mateusz Gamrot | 9.95 |
| Steven Asplund | 82.7 | Steven Asplund | 9.18 |
| Manoel Sousa | 80.0 | Ty Miller | 9.15 |
Two rows carry the story. Del Valle is the slate's most expensive fighter and its top projection at 96.0, and at $9,600 that works out to exactly 10 points per $1,000 of salary, an elite number for a max-priced fighter. And Salkilld projects for 93.0, second on the whole card, without appearing on the salary board at all, which means he costs no more than $8,900. That combination is why his 11.21 leads the value panel by more than a full point. Meanwhile Carol Foro carries the second-highest salary at $9,300 and does not appear on the projection or value panel; the sheet never says "avoid" out loud, but a max-priced fighter missing both boards is the closest it comes.
The ownership panel tells you where the field is going. Salkilld leads at 41.3%, followed by Diego Ferreira (36.8%), Mateusz Gamrot (36.3%), Diyar Nurgozhay (35.0%) and Juliana Miller (33.8%). Both halves of the main event are projected among the five most-rostered fighters on the slate, and that is no accident, which brings us to the one scoring fact that shapes every Fight Night board.
Why The Five-Round Main Event Bends The Whole Sheet
A Fight Night main event is scheduled for five rounds, not three. That is the single most important scoring fact on any Fight Night slate: 25 minutes of potential significant strikes and control time gives both Gamrot and Salkilld a scoring ceiling nobody on the undercard can reach, and it is why main-eventers are priced and owned the way they are. Salkilld's 93.0 projection, second on the card from a sub-$8,900 salary, is largely five-round math. The field understands this too, which is why both men clear 36% projected ownership.
The APEX cage adds a second layer. APEX cards run in a smaller cage than the UFC's arena shows, and that is a commonly cited reason finish rates trend higher there. I treat it as a factor the field already knows rather than a law, and this week's sheet backs that up: five fighters projected at 33.8% ownership or higher on a single card is a field already paying for finish upside. So the useful question is never "is this factor real," it is "is this factor already priced into ownership." That is a leverage-panel question, so let's go there.
| Highest Ownership | Own% | Top Exposures | Exp% | Leverage Plays | Lev% |
|---|---|---|---|---|---|
| Quillan Salkilld | 41.3% | Quillan Salkilld | 64.7% | Quillan Salkilld | 22.7% |
| Diego Ferreira | 36.8% | Jose Montanha | 42.0% | Jose Montanha | 19.6% |
| Mateusz Gamrot | 36.3% | Steven Asplund | 42.0% | Steven Asplund | 12.8% |
| Diyar Nurgozhay | 35.0% | Yadier del Valle | 38.7% | Yadier del Valle | 9.2% |
| Juliana Miller | 33.8% | Manoel Sousa | 35.3% | Manoel Sousa | 4.3% |
The exposure panel is the sheet's sharpest tool, and it is worth being precise about what it measures. Top-150 exposure is how often a fighter appears in the 150 highest sim-ROI lineups, the best rosters out of the entire simulated pool. Salkilld shows up in 64.7% of them while the field rosters him at 41.3%, and the leverage panel, which measures the gap between the Sims' optimal exposure and projected field ownership, puts his edge at 22.7%, the biggest number on the board. Note that optimal exposure is its own modeled figure, not the top-150 number shown on the exposure panel, so the two panels will not subtract cleanly. The Sims are saying the field is right about Salkilld and still not on him heavily enough.
Jose Montanha's row is the one I keep coming back to, though. He appears in 42% of the top-150 lineups and does not crack the top five in field ownership at all, which means his ownership sits below Juliana Miller's 33.8%. That 19.6% leverage on a fighter the field is comparatively ignoring is the kind of row that wins tournaments, and it is invisible if you only read the ownership panel. The mirror image is Gamrot: 36.3% owned, third on the value board at 9.95, yet absent from both the exposure and leverage panels. The sim pool leans toward the other side of the main event, and the sheet tells you that without a single word of fight analysis.
How The Numbers Are Built
Every panel comes out of Stokastic Sims, which fight the card tens of thousands of times instead of ranking fighters off a single static projection. In MMA that distinction matters more than in any other DFS sport, because a fight is close to a binary event with a fat tail: the same fighter can be finished in 90 seconds or grind out a 25-minute decision, and those two outcomes sit at opposite ends of the DraftKings scoring range. A lone median number hides that spread entirely, and the spread is exactly the information a tournament roster is built on. The 96.0 next to del Valle's name is the middle of a distribution, not a promise.
The same simulation engine produces the rest of the sheet. Ownership is modeled as a distribution too, projecting how the field will allocate salary across the card. The exposure panel comes from the ROI-ranked lineup pool: the Sims assemble full six-fighter rosters from the simulated outcomes, rank the pool by simulated ROI, and count who keeps showing up in the top 150. That is why exposure and ownership can disagree so sharply on a fighter like Montanha, and the disagreement, not either number alone, is the edge. If you want the full engine on card day, the UFC DFS projections, ownership and stacks in the DataHub are where the sheet's numbers live at full depth.
One honest caveat: the sheet is a snapshot. A short-notice replacement or a missed weight changes a fighter's projection more than almost anything in DFS, so the board you build from should be the one published closest to lock.
Worked Example: Walking Salkilld's Row Into A Roster
Here is the panel-to-roster move the whole article has been building toward, using only numbers on this week's sheet. DFS edge comes from accurate projected value plus leverage against the field's final ownership, so I start with the fighter who leads both panels: Salkilld, at a salary no higher than $8,900.
- Slot 1, The Leverage Anchor: Salkilld, 93.0 projection, 11.21 value, 22.7% leverage. Cap spent: at most $8,900.
- Slot 2, The Projection Anchor: del Valle at $9,600, the top projection at 96.0 and still 10.00 value at max price. Cap spent: roughly $18,500.
- Slots 3 Through 6: about $31,500 remains, or roughly $7,875 per slot, which is enough to fit one more salary-panel fighter and still shop the middle of the board.
Compare that with the alternative the salary panel tempts you toward: pairing del Valle with Foro costs $18,900 for two fighters, one of whom misses the projection panel entirely. Same cap spend, a projection panel's worth of difference. Because Salkilld gives back salary and adds leverage, I can afford Asplund at $9,000, who carries 12.8% leverage of his own and 42% top-150 exposure, and my three remaining slots still average about $7,500. One value row changed what the entire rest of the roster can afford; that is what "salary allocation is the whole game" means in practice. The free sheet shows only five rows per panel, so the last three names come from shopping the mid-board with the full projections; what the sheet has already decided is the shape of the build and where its edge lives. In a large-field tournament I would rather be the roster that read the exposure panel than the one that read the salary panel, and tournament strategy is mostly learning to make that trade on purpose.
Every number in that build came off the free board. What the paid side adds is everything underneath it: the full projection set for every fighter on the card, not five rows, plus Ownership Projections for the whole slate and the complete ROI-ranked lineup pool instead of a top-150 summary. The cheat sheet is the preview; the Sims are the product.
More on this: DraftKings NFL DFS Cheat Sheet: Week 1 Picks And Stacks · DraftKings PGA DFS Cheat Sheet: Sims, Projections And Ownership · DraftKings MLB DFS Cheat Sheet: Projections, Ownership & Stacks For August 3 · DraftKings NFL Showdown Cheat Sheet: Week 1 TNF · DraftKings NFL Showdown Cheat Sheet: Patriots At Seahawks
The Skill That Carries To Every Card
Everything above is one skill: reading six panels as a single argument instead of six lists. This week the argument runs from the salary panel's mispriced top row, through the five-round ceiling that puts both main-eventers atop ownership, to the exposure panel quietly siding with Salkilld and Montanha. Next card the names change and the argument changes with them, and that is the point: the cheat sheet is a language, and once you read it fluently, every UFC Saturday starts with a two-minute read instead of two hours of tape. For the strategy layer that sits on top of the sheet, the UFC DFS strategy guide is the next read.
21+.