
DraftKings MLB DFS Cheat Sheet: Projections, Ownership & Stacks For August 3
By Sam Smith
August 3, 2026
Stokastic's free DraftKings MLB DFS cheat sheet is six small tables that condense tens of thousands of simulations into a two-minute read, and Monday, August 3 is the right night to learn it. The Tampa Bay Rays are at Coors Field, and three of the sheet's six panels bend toward that one game: Rays fill three of the five exposure rows, four of the five leverage rows, and the top of the stack panel by a mile. Learn why one road team can warp that much of the sheet at once and you can read it on any slate. By the end I will take one row, Junior Caminero's, and walk it all the way into a DraftKings roster.
The Quick Answer
The DraftKings MLB DFS cheat sheet is a free daily board built from a full Stokastic Sims run, split into six panels: projections, ownership, value, top-150 exposure, leverage and 5-stacks. Read it in that order. Settle your two pitcher slots first, because DraftKings makes you roster two, then build your tournament core from the leverage and 5-stack panels rather than the ownership panel. The panel-by-panel breakdown, the DraftKings-specific roster math, and a worked example from tonight's Rays-at-Coors board are all below.
What The DraftKings MLB DFS Cheat Sheet Is
The cheat sheet is the free daily summary of what the paid Stokastic Sims produce for that night's DraftKings main slate. The Sims play the slate tens of thousands of times, assemble a pool of lineups, rank that pool by simulated ROI, and the sheet skims the top of the output into six panels.
The sheet itself costs nothing, every day, no package required, and no promo code touches it because there is nothing to discount. The code below applies to the paid Stokastic MLB DFS packages behind the sheet, where the full MLB DFS projections, Ownership Projections, Boom/Bust and the Sims themselves live. Code CHEAT takes 15% off your first week or month of any Stokastic MLB DFS package.
Tonight's edition covers an eight-game DraftKings main slate, and the sheet's loudest number sits in the bottom-right panel. Hold that thought; it pays off two sections from now.
The Six Panels And How To Read Each One
| Panel | What the number is | How I act on it |
|---|---|---|
| Top Projections (Proj FP) | Median projected DraftKings fantasy points | Sets the pecking order for my two pitcher slots |
| Highest Ownership (Own%) | Projected field ownership | Where the field will be, not where I should be |
| Top Values (Value) | Projected points per $1K of salary | The cheap bats that fund a two-pitcher spend |
| Top Exposures (Exp%) | Top-150 exposure: how often a player appears in the 150 highest sim-ROI lineups | The Sims' actual shopping list |
| Leverage Plays (Lev%) | The gap between optimal exposure and field ownership | Where tournament edge comes from |
| Top 5-Stacks (5-Stack%) | The five-batter team stacks the Sims build most often | My primary stack menu |
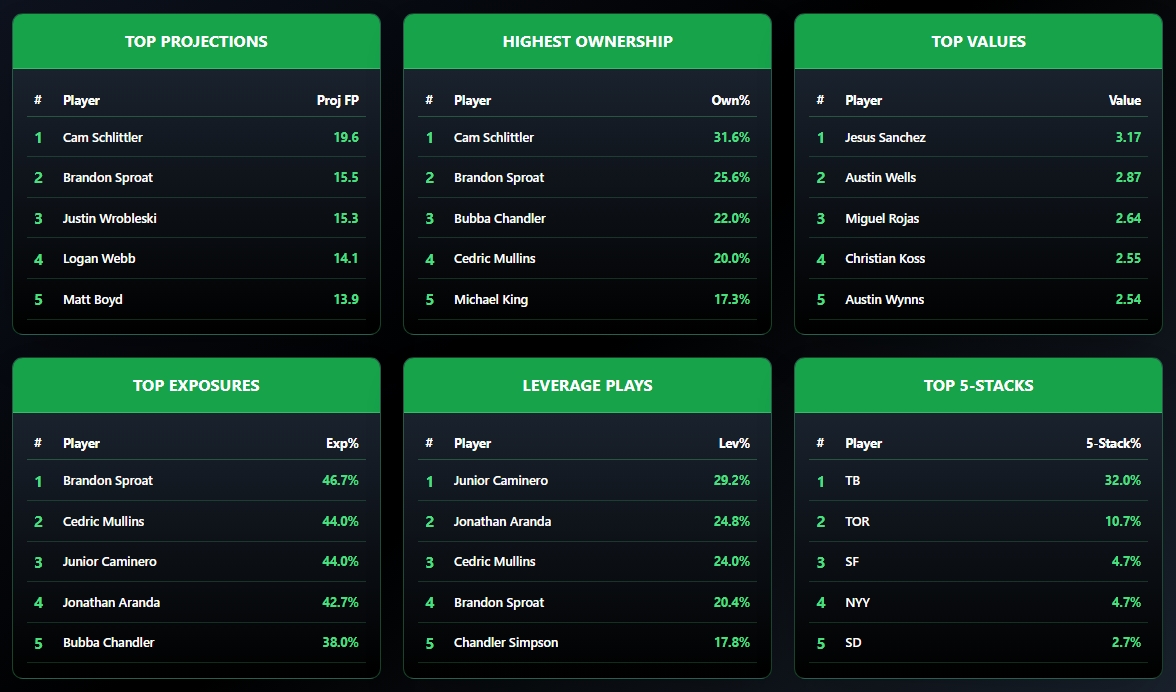
Tonight's projections panel is all pitchers, which is exactly what it should be on DraftKings: Cam Schlittler leads at 19.6 projected DraftKings points at home against St. Louis, then Brandon Sproat (15.5), the Dodgers' Justin Wrobleski (15.3), Logan Webb (14.1) and Matt Boyd (13.9). Ownership says the field agrees, and then some. Four of the five most popular players on the board are arms: Schlittler at 31.6% owned, Sproat at 25.6%, Bubba Chandler at 22.0% and Michael King at 17.3%, with Cedric Mullins the lone bat at 20.0% ownership.
The value panel is where the sheet quietly funds those pitchers: Jesús Sánchez sits 1st in value at 3.17 projected points per $1K of salary, then Austin Wells (2.87), Miguel Rojas (2.64), Christian Koss (2.55) and Austin Wynns (2.54). A value outfielder, cheap catchers and middle infielders are not exciting, but two pitcher salaries have to come from somewhere.
Then the two panels that actually build tournament lineups. Top-150 exposure is a count, not an opinion: Sproat sits 1st in top-150 exposure, appearing in 46.7% of the 150 highest sim-ROI lineups, with Mullins and Caminero next at 44.0% each, Jonathan Aranda at 42.7% and Chandler at 38.0%. The leverage panel subtracts field ownership from optimal exposure, and Caminero (29.2%) leads it, ahead of Aranda (24.8%), Mullins (24.0%), Sproat (20.4%) and Chandler Simpson (17.8%).
The definition in one row: Mullins carries 44.0% top-150 exposure against 20.0% projected ownership, and 44.0 minus 20.0 is exactly his 24.0% leverage. Exposure is what the Sims want, ownership is what the field will do, and leverage is the gap you get paid for.
The 5-stack panel closes the argument, and it is the number I promised: the Sims build a Tampa Bay five-stack in 32.0% of their best lineups tonight. Toronto sits 2nd in the panel at 10.7%, then San Francisco and the Yankees at 4.7% and San Diego at 2.7%. A 21.3-point gap between the first and second stack is the whole slate in one cell, and the reason is not a mystery. Caminero, Aranda, Mullins and Simpson are all Rays, and the Rays are the only team playing a mile above sea level tonight.
How DraftKings Rules Change The Read
None of those numbers mean anything without DraftKings' roster sheet in front of you, and this is where the DraftKings and FanDuel differences change decisions rather than trivia. A DraftKings MLB classic roster is ten slots under a $50,000 cap: two pitchers, then C, 1B, 2B, 3B, SS and three outfielders.
Two pitcher slots means pitching carries roughly twice the build weight it does on one-pitcher sites. That is why I read the projections panel as a pitcher panel first, and why tonight's board, with arms in nine of the ten projection and ownership rows, is normal rather than strange. It also means the value panel is load-bearing: nobody fits two quality starts and a Coors five-stack under $50,000 without a couple of 2.5-plus value bats filling the C and middle-infield slots.
DraftKings also caps you at five hitters from one team, and that cap is why the sheet's stack panel is built around five-man stacks. Five correlated bats is the classic DraftKings tournament shape: when a team puts up a crooked number, five stacked hitters collect the singles, runs and RBI together, and the correlation math does the ceiling-raising for you. A five-stack plus your two pitchers leaves exactly three hitter slots, which is why the standard pairing is a 5-3: a primary five-stack and a secondary three-man mini-stack from another offense the sheet likes.
Scoring is the last piece, and it decides how you fade:
| DraftKings MLB Scoring (Core) | Points |
|---|---|
| Single | 3 |
| Double / Triple | 5 / 8 |
| Home Run | 10 |
| Run / RBI | 2 / 2 |
| Walk Or Hit-By-Pitch | 2 |
| Stolen Base | 5 |
| Pitcher: Per Inning / Per Strikeout | 2.25 / 2 |
| Pitcher: Win | 4 |
| Pitcher: Earned Run Allowed | -2 |
| Pitcher: Hit, Walk Or Hit Batter Allowed | -0.6 each |
The row that matters is the walk: DraftKings pays it 2 while a single pays 3, the opposite of FanDuel's walk parity. Patient chalk has a lower floor here, and batted-ball power matters relatively more, which is one more reason the Sims chase hard contact at altitude so aggressively.
The practical read: on DraftKings I spend my thought on the two pitcher slots and the shape of my 5-3, and I let the leverage panel, not the ownership panel, pick which five-stack I actually enter. For cash games, flip the emphasis: projections and value are your panels, and leverage and exposure are tournament tools. One note on formats: the cheat sheet is built for the classic main slate. In single-game Showdown contests, with one captain scoring 1.5x, panels built on full-slate ownership and 150-lineup pools do not translate row for row.
How The Stokastic Sims Build These Numbers
Every panel is one engine viewed from six angles, and knowing the engine tells you how much weight each number holds. The Stokastic Sims do not rank players off a static projection list. They simulate the slate tens of thousands of times with correlation intact, so a Rays five-stack scores in the sim the way it would at Coors: when Caminero clears the fence, Simpson and Mullins are crossing the plate in front of him. Ownership Projections run through the same engine as a distribution rather than a single guess, which is how the leverage panel can price the gap between what the Sims want and what the field will do. The lineup pool then gets ranked by simulated ROI, and the top 150 become the exposure and leverage panels you just read. The MLB DFS Sims guide goes deeper on the pipeline, and the full output behind the sheet, MLB DFS projections, ownership and stacks, lives in the MLB DataHub.
Six top-five panels are the skim. The paid layer is the same engine with the lid off, which is the honest version of the upsell: the sheet shows you the Sims' five favorite exposures, the packages show you all of them.
From One Row To A Roster: Tonight's Worked Example
Now the promised walk-through. Caminero's line across tonight's board: 44.0% top-150 exposure, 29.2% leverage, the board's number one leverage play, inside a Tampa Bay stack the Sims build 32.0% of the time.
Why the Sims are this loud: Caminero brings a 13.5% barrel rate, a .507 expected slugging and 50% hard-hit contact into the best hitters' park in baseball, against Michael Lorenzen, who has allowed 9.0% barrels and a .473 expected slugging. Hard contact, a hittable arm, altitude. The 29.2% leverage number says the field will roster the spot at roughly a third of the rate the Sims do, and that gap, not the projection, is the tournament argument.
So the build falls out in steps:
- Fill the five-stack. Caminero at 3B, and the sheet has already named three partners: Aranda (42.7% exposure), Mullins (24.0% leverage) and Simpson (17.8% leverage). The fifth Ray comes from the full sheet or the DataHub's stacks table, which is where the sheet hands off to the paid layer.
- Add the secondary. Toronto's 10.7% stack row is the natural bridge, and the value panel already flagged its anchor: Sánchez, the board's top value at 3.17, with a 10.7% barrel rate and .454 expected slugging of his own. Take him plus one more Jay as a two-man pair, or extend to the full three-man Toronto stack for the classic 5-3 and skip the one-off in step four.
- Pay for two arms. Schlittler is chalk at 31.6% for a reason; his .342 expected slugging allowed is comfortably better than Sproat's .410 and miles better than the .473 Lorenzen carries into Coors, and home against St. Louis is the right spot to pay for it. Your other slot should go to the Sims' actual favorite arm: Sproat, the sheet's top overall exposure at 46.7% with 20.4% leverage on top. The fun wrinkle: Sproat and Chandler start against each other in Milwaukee, and the Sims happily roster both ends of a pitchers' duel, since two starters only fight over one win bonus, not over fantasy points.
- Spend the last slot on the value column. With the 5-2 core, the final hitter slot goes to Wells at 2.87, a one-off Yankee bat against a St. Louis starter allowing a .499 expected slugging. And if the two arms squeeze the cap anywhere, Rojas (2.64), Koss (2.55) and Wynns (2.54) are the swaps the sheet has already vetted at their positions.
Notice what never came up: the ownership panel. It described the field, then the leverage panel beat it. Michael King draws 17.3% projected ownership tonight and does not crack the exposure panel's top five, a hint the Sims are cooler on him than the field is.
Before you build your own version of that lineup, this is the moment the sheet is designed for: the free panels found the argument, and the paid layer holds the rest of the exposure list. Code CHEAT takes 15% off your first week or month of any Stokastic MLB DFS package.
One honest caveat. Exposure and leverage are tournament numbers built from simulated large-field ROI, not floor plays, and a 29.2% leverage bat can absolutely go 0-for-4 at Coors. If you are new to tournament thinking, the DFS tournament strategy guide explains why you judge the process over a month, not one Monday. And because the sheet posts before lineups are official, confirm your bats are actually starting and know how weather and late swap work; Coors wind and mountain rain move numbers after the board prints.
More on this: DraftKings MLB DFS Cheat Sheet: Aug. 28 Picks And Stacks · FanDuel MLB DFS Cheat Sheet: Projections, Ownership & Stacks · DraftKings NFL DFS Cheat Sheet: Week 1 Picks And Stacks · DraftKings PGA DFS Cheat Sheet: Sims, Projections And Ownership · DraftKings MMA DFS Cheat Sheet: Sims, Projections And Ownership
Six Panels, One Argument
Read tonight's board back to front and it tells a single story: the Rays are at Coors, the Sims build their five-stack a third of the time, Caminero carries the widest field-versus-math gap on the slate, and the value column exists so you can afford two real pitchers to go with it. A good MLB DFS cheat sheet never hands you a finished lineup; it hands you that argument. Caminero can wear an 0-for-4 tonight and the read was still right, because you are playing the gap between the field and the simulation, not the box score. You must be 21+ to play.
When you want the full pool behind the panels, the Sims, Ownership Projections and Boom/Bust are the paid layer, and the code takes 15% off your first week or month.
Stokastic MLB DFS packages, code CHEAT for 15% off your first week or month
Use code CHEAT
Get Started