
World Series Odds Vs The Sims: The Market Is Coming Around On Milwaukee
By Jake Hari
August 11, 2026 · Updated September 3, 2026
Updated September 3, 2026 · by Jake Hari
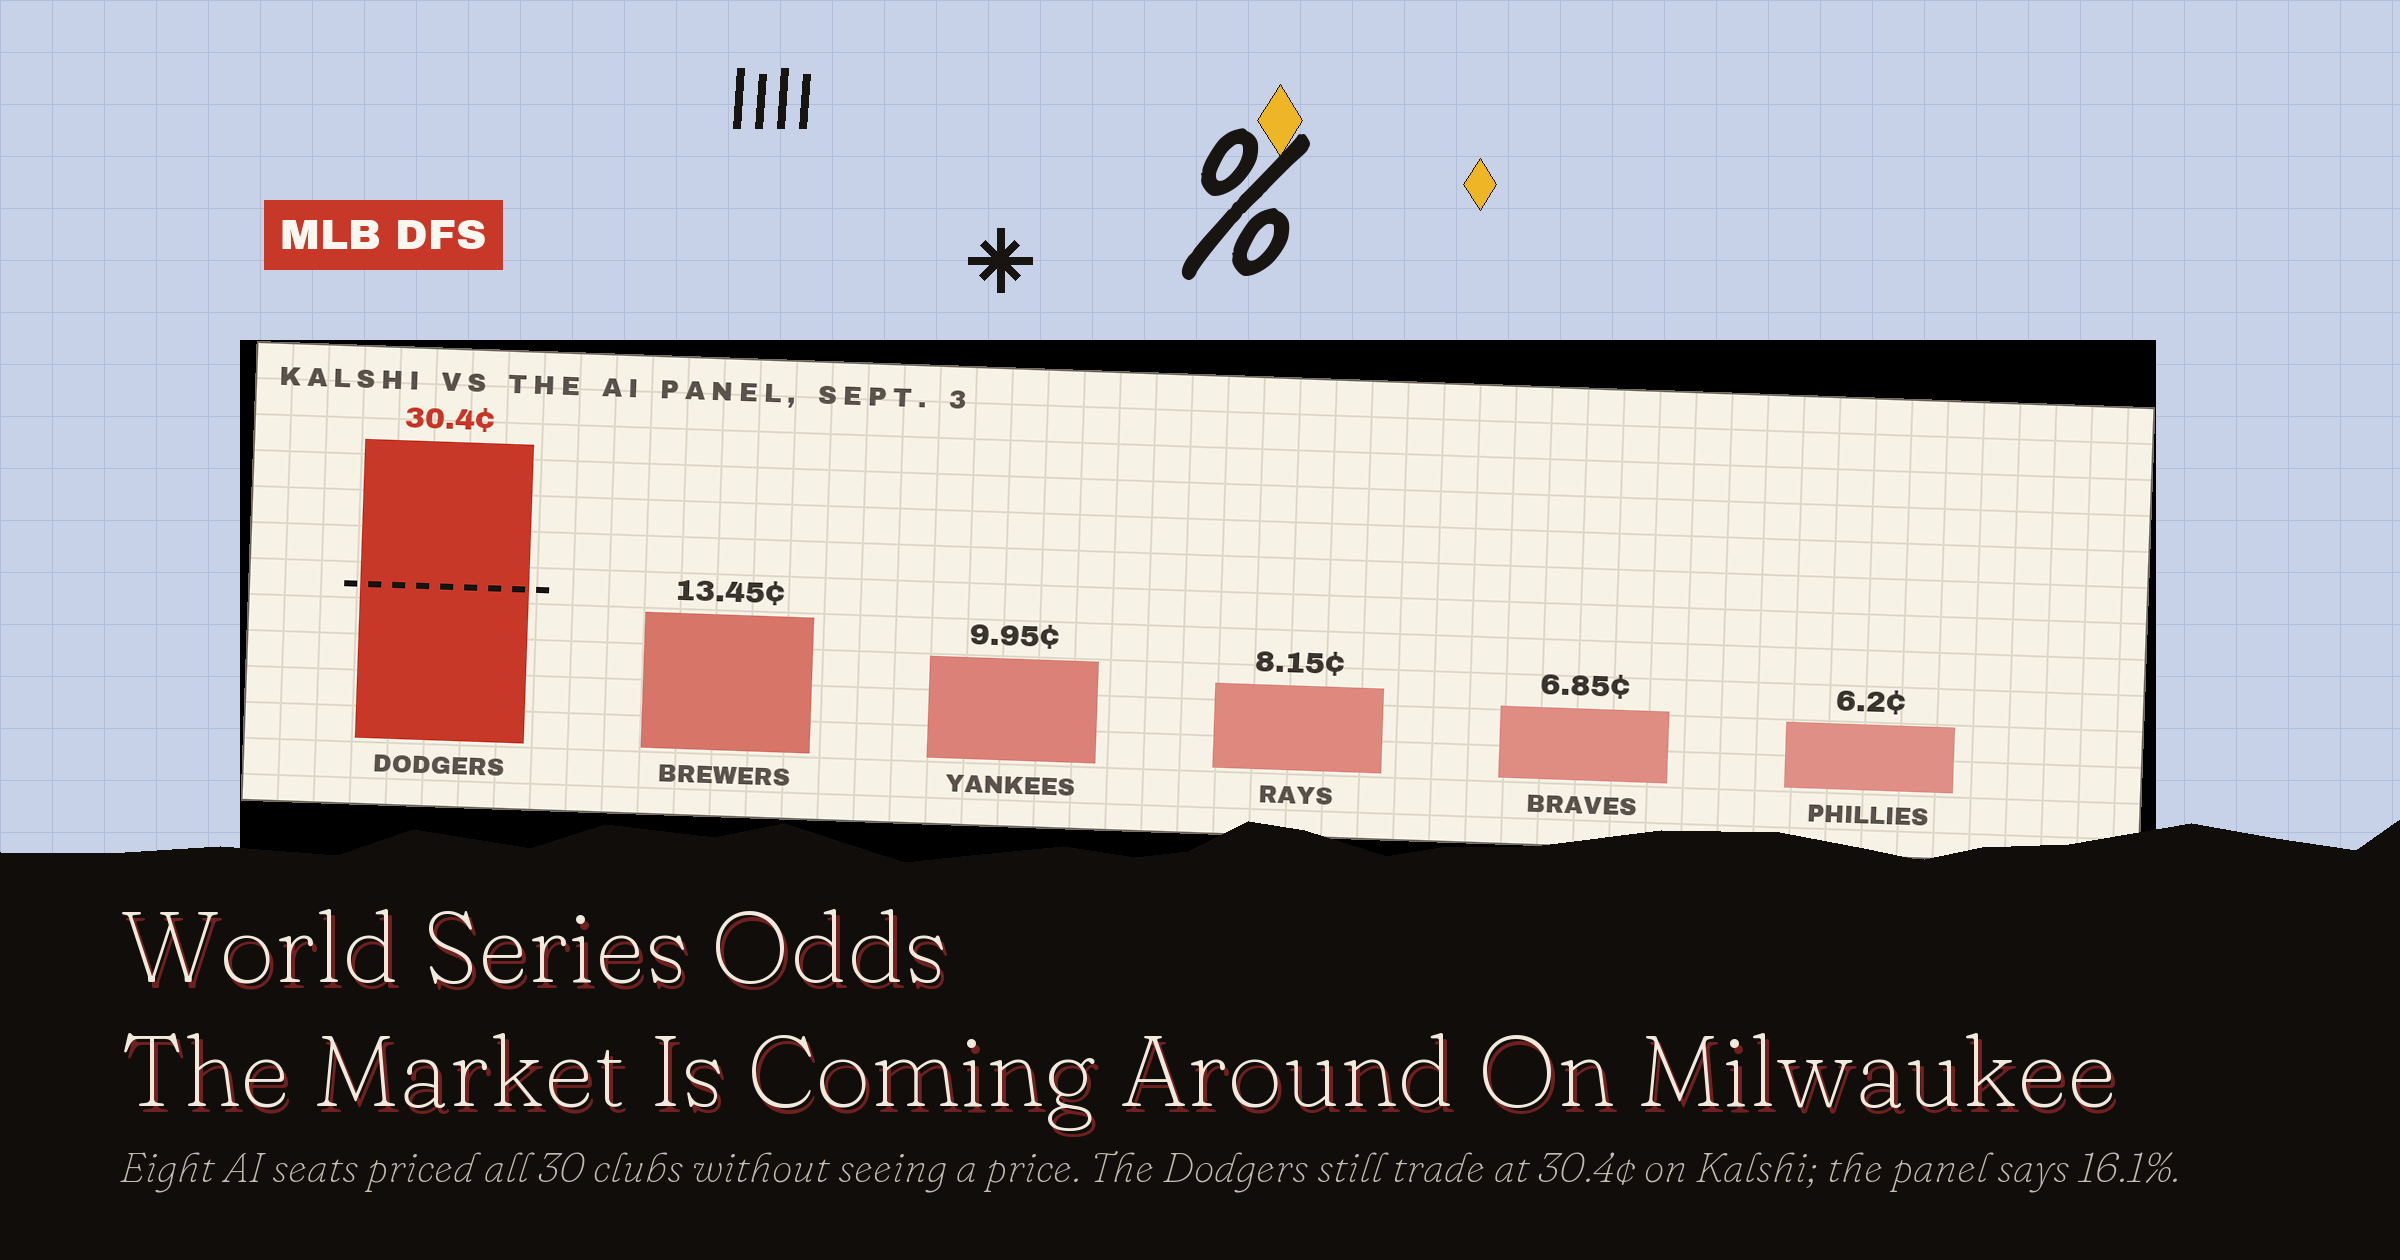
When this page first went up on August 10, the World Series odds on Kalshi had one number that dwarfed everything: the Los Angeles Dodgers at 38 cents, four times the price of a Milwaukee Brewers club that owned baseball's best record. The argument then was that no simulation built on records and run differentials could reproduce a gap that wide. Twenty-four days later the market has done most of the arguing itself. The Dodgers trade at 30.4 cents, the Brewers at 13.45, and the contract that turned over the most money in the last 24 hours was not the favorite's. It was Milwaukee's, by a wide margin, and it is the row I keep coming back to.
So this September edition is a page about a market correcting in slow motion, and about whether the correction is finished. The method has not changed. Take the live price on all 30 clubs, lay it against an eight-model AI panel that priced the same 30 clubs from the same standings without seeing a single market number, and read the gaps. Where the two agree, there is little to argue about. Where they still split, you have found the part of the stretch run worth an extra 10 minutes, because a disagreement about who wins in October is, underneath, a disagreement about how much a bye, a rotation and a six-month record are worth in a short series. For a DFS player that is the same decision every slate turns on: pay for the highest projection, or take a player with the same expected score at a fraction of the price.
The Quick Answer
The Dodgers are still the World Series favorite on Kalshi at 30.4 cents, down from 38 cents on August 10, and the eight-seat panel still prices them at 16.1 percent, so the widest gap on the board has narrowed from about 22 points to 14 without closing. Milwaukee has gone the other way, from 9 cents to 13.45 against a panel read of 16.9 percent, and it now holds the National League's top bye at 87-53 while the Dodgers, at 82-57, have slipped a half-game behind Atlanta for the second one. The Yankees at 9.95 cents are the biggest price the market and the models agree on. The full 30-club board, how every contract has moved since August, the round-by-round math a 30-cent favorite has to clear, and what tonight's six-game DraftKings slate has to do with any of it are below.
How The Panel Priced This Board
The model column on this page comes from the OddsShopper AI panel's World Series board, which is where every seat's individual number and its full reasoning live. Eight seats, Claude Fable, Claude Opus, Claude Sonnet, GPT, Gemini, GLM, Kimi and DeepSeek, each received the same fetched data card on August 22: the live standings for all 30 clubs, run differentials, the bye picture, and 31 seasons of actual champions from 1995 through 2025. No prices. Each seat distributed 100 points across the field, read the other seats' anonymized numbers once, and could revise once. The panel figure below is the median of the eight after that revision round, rescaled to sum to 100.
Two things about timing matter. The verdicts are frozen on August 22 on purpose: a call that gets quietly re-fit after two weeks of results is not a call anyone can grade, and every one of these numbers gets graded in public on the panel's scoreboard when the market settles. The prices are live, fetched September 3, 2026 at 3:27 PM ET. So the gap column measures two things at once: what the market has learned in 12 days and what the panel could not know. Where the standings since August 22 cut against a panel number, and on two clubs they do, I say so in that club's section rather than pretend the number saw it coming.
The panel's read is not a Stokastic Sims output. Our Sims simulate a DFS slate thousands of times; they do not simulate a postseason bracket. What this page borrows from them is the discipline: a probability is only worth what you paid for it, and the field's price for a team is not the same thing as the team's chance.
What Moved Since August 10
Before the full board, the movement, because on a page that freezes its model verdicts the movement is the new information. Three reads are laid side by side below: this page's original August 10 sticker, the August 22 midpoint the panel was compared against, and the live midpoint today. A contract's Kalshi price in cents reads directly as a percentage.
| Club | Aug 10 | Aug 22 | Sept 3 | Move since Aug 10 | Panel |
|---|---|---|---|---|---|
| Los Angeles Dodgers | 38¢ | 32.85¢ | 30.4¢ | -7.6 | 16.1% |
| Milwaukee Brewers | 9¢ | 12.3¢ | 13.45¢ | +4.45 | 16.9% |
| New York Yankees | 10¢ | 9.5¢ | 9.95¢ | -0.05 | 9.6% |
| Tampa Bay Rays | 6¢ | 7.95¢ | 8.15¢ | +2.15 | 8.6% |
| Atlanta Braves | 7¢ | 5.95¢ | 6.85¢ | -0.15 | 9.6% |
| Philadelphia Phillies | 4¢ | 4.95¢ | 6.2¢ | +2.2 | 4.4% |
| Chicago Cubs | 6¢ | 5.15¢ | 5.5¢ | -0.5 | 7.6% |
| Boston Red Sox | 7¢ | 5.55¢ | 4.95¢ | -2.05 | 7.0% |
| Chicago White Sox | 2¢ | 3.05¢ | 3.85¢ | +1.85 | 5.1% |
| Houston Astros | 2¢ | 2.6¢ | 3.25¢ | +1.25 | 2.6% |
| Cleveland Guardians | 0-1¢ | 0.8¢ | 2.15¢ | +1 to +2 | 0.9% |
| Seattle Mariners | 2¢ | 1.65¢ | 1.45¢ | -0.55 | 0.4% |
| Detroit Tigers | 1¢ | 0.9¢ | 0.15¢ | -0.85 | 1.3% |
August 10 prices are this page's original whole-cent reads; August 22 prices are the Kalshi midpoints the panel was compared against on the OddsShopper board; September 3 prices are live midpoints at 3:27 PM ET. Panel is the eight-seat median from August 22. Cleveland's August 10 price sat inside this page's 0-1 cent field bucket, so its move is shown as a range.
The row that matters most is the first one. Los Angeles has given back 7.6 cents in 24 days, a fifth of its price, and 2.45 of those cents came after the panel scored. The second row is its mirror: Milwaukee has picked up 4.45 cents, and its 24-hour trading volume on September 3, about $111,000 in face value, the dollar value of the contracts if every one paid out, was nearly double the Dodgers and Yankees combined, on a board that turned over about $526,000 in the same window. The turnover is concentrating on the club the panel had first, not on the favorite.
Read down the table and a pattern shows up. Of the seven clubs where the panel sat more than a point from the August 22 price, six have since moved toward the panel: the Dodgers down, the Brewers, Braves, White Sox and Cubs up, Seattle down. Only Boston moved the other way. Two more clubs the panel had priced close to the market have since pulled away from it. Philadelphia has added 2.2 cents since August 10 while the panel had the Phillies as the one contender other than the Dodgers priced above its number, and Cleveland has nearly tripled from 0.8 cents to 2.15 while the panel gave the Guardians less than a point. Both of those are standings stories, and both are unpacked below. The market did the closing on the big gaps, and on the small ones it is writing its own script.
The Board: All 30 Clubs
Every club, sorted by price. "Kalshi" is the live midpoint of the best bid and best ask on each club's yes contract in cents, which reads directly as a percentage. "Panel" is the eight-seat median from August 22. "Gap" is panel minus market, so a positive number means the models like a club more than the money does. Records and playoff position are from the league's standings feed at about 3:25 PM ET on Thursday, September 3, after the day's first game, San Francisco at Pittsburgh, had gone final; the Blue Jays-Guardians and White Sox-Astros games were in progress at the read, and those four clubs' records are as of the start of play; a bye goes to each league's two division winners with the best records, and those clubs skip the best-of-three wild card round.
| Club | Record | Where it sits | Kalshi | Panel | Gap |
|---|---|---|---|---|---|
| Los Angeles Dodgers | 82-57 | Division lead, no bye (0.5 back) | 30.4¢ | 16.1% | -14.30 |
| Milwaukee Brewers | 87-53 | Division lead, bye | 13.45¢ | 16.9% | +3.45 |
| New York Yankees | 80-60 | Wild card 1 | 9.95¢ | 9.6% | -0.35 |
| Tampa Bay Rays | 83-56 | Division lead, bye | 8.15¢ | 8.6% | +0.45 |
| Atlanta Braves | 83-57 | Division lead, bye | 6.85¢ | 9.6% | +2.75 |
| Philadelphia Phillies | 79-61 | Wild card 1 | 6.2¢ | 4.4% | -1.80 |
| Chicago Cubs | 78-62 | Wild card 2 | 5.5¢ | 7.6% | +2.10 |
| Boston Red Sox | 75-65 | Wild card 2 | 4.95¢ | 7.0% | +2.05 |
| Chicago White Sox | 73-66 | Division lead, bye | 3.85¢ | 5.1% | +1.25 |
| Houston Astros | 71-69 | Division lead, no bye | 3.25¢ | 2.6% | -0.65 |
| Cleveland Guardians | 70-69 | Wild card 3 | 2.15¢ | 0.9% | -1.25 |
| San Diego Padres | 73-67 | Out, 0.5 back | 1.7¢ | 3.2% | +1.50 |
| Seattle Mariners | 66-74 | Out, 4.5 back | 1.45¢ | 0.4% | -1.05 |
| Texas Rangers | 69-71 | Out, 1.5 back | 1.25¢ | 2.0% | +0.75 |
| Toronto Blue Jays | 69-71 | Out, 1.5 back | 1.05¢ | 0.2% | -0.85 |
| Arizona Diamondbacks | 74-67 | Wild card 3 | 0.95¢ | 1.7% | +0.75 |
| Baltimore Orioles | 69-71 | Out, 1.5 back | 0.3¢ | 0.2% | -0.10 |
| Minnesota Twins | 67-73 | Out, 3.5 back | 0.25¢ | 0.8% | +0.55 |
| St. Louis Cardinals | 70-70 | Out, 3.5 back | 0.15¢ | 0.6% | +0.45 |
| Miami Marlins | 71-69 | Out, 2.5 back | 0.15¢ | 0.5% | +0.35 |
| Detroit Tigers | 64-75 | Out, 6.0 back | 0.15¢ | 1.3% | +1.15 |
| Washington Nationals | 67-75 | Out, 7.5 back | 0.05¢ | 0.1% | +0.05 |
| Pittsburgh Pirates | 69-72 | Out, 5.0 back | 0.05¢ | 0.3% | +0.25 |
| Cincinnati Reds | 67-73 | Out, 6.5 back | 0.05¢ | 0.1% | +0.05 |
| New York Mets | 63-77 | Out, 10.5 back | 0.05¢ | 0.1% | +0.05 |
| Kansas City Royals | 62-78 | Out, 8.5 back | 0.05¢ | 0.1% | +0.05 |
| San Francisco Giants | 58-83 | Out, 16.0 back | 0.05¢ | 0.0% | -0.05 |
| Los Angeles Angels | 53-87 | Out, 17.5 back | 0.05¢ | 0.0% | -0.05 |
| Colorado Rockies | 54-86 | Out, 19.5 back | 0.05¢ | 0.0% | -0.05 |
| Athletics | 54-86 | Out, 16.5 back | 0.05¢ | 0.0% | -0.05 |
Kalshi midpoints as of September 3, 2026, 3:27 PM ET. 21 of the 30 contracts carried both a bid and an ask; the other nine sat at a zero bid and a one-tenth-of-a-cent ask, which is a displayed market rather than a live quote. The 30 midpoints sum to about 102.6 cents, so the board is priced about two and a half cents rich once you add every club together, down from about 104 on August 10. Panel verdicts generated August 22, 2026, price-blind.
More live boards from the same panel: NL champion 2026 has the Dodgers on top at 40.5¢ · AL pennant 2026 has the Yankees on top at 24¢ · World Series matchup 2026 prices Yankees vs Dodgers at 11.75¢. Prices fetched September 3, 2026, about 4:01 PM ET.
Read the gap column top to bottom before you read any single row. It has exactly one number bigger than four in either direction, and it belongs to the favorite. Every other club on the board sits within three and a half points of the panel, and 19 of the 30 sit within one. A gap column like that is the shape of a market and a model that mostly agree, which is the normal outcome and a decent argument that both are working. The row I would stare at is not the Dodgers, though. It is the White Sox at 73-66, holding the American League's second bye at 3.85 cents, priced below a Yankees club that does not have one. The bracket is paying Chicago a round off, and the market is paying it less than four cents for it. Where the panel's one big gap and the market's one odd row came from is the rest of this page.
Dodgers: The Gap That Is Closing, Slowly
Los Angeles is 82-57 with a plus-146 run differential, the second-best mark in baseball behind Milwaukee, and the two-time defending champion chasing a third straight title, the only back-to-back run in the panel's 31-season history file since the Yankees of 1998 to 2000. At the August 3 deadline it added Tarik Skubal from Detroit. All of that was in front of all eight models, and the highest number any of them gave the Dodgers was 17.1 from Claude Fable; the lowest was 14.0 from Claude Opus. The panel's read is that Los Angeles is one of the two best clubs in baseball, and that being one of the two best clubs in baseball has historically been worth the mid-teens, not a third of the board.
The history file is where that ceiling comes from. Across the 31 seasons from 1995 through 2025, the club with baseball's best regular-season record went on to win the title 8 times, or 26 percent. The median champion ranked fourth in baseball by winning percentage. Fifteen of the 31 champions were top-three clubs, which means roughly half were not. Opus was most aggressive on the point, arguing that the National League's strength advantage only cashes in the World Series itself, and that a stronger NL survivor beats a weaker AL survivor about 55 percent of a best-of-seven rather than the 60-plus the rest of the panel implied.
The standings since August 22 have cut against the market's number. On August 22 the Dodgers held a bye. Entering play September 3 they do not: Atlanta, at 83-57, sits a half-game ahead of them for the National League's second bye, and Los Angeles has gone 4-6 over its last 10. A price of 30.4 cents with no bye is a four-series path, a best-of-three, a best-of-five and two best-of-sevens, and 30.4 percent across four rounds requires winning each one about 74 percent of the time. Reclaim the bye and the path drops to three series and about 67 percent per round. On August 10 the same arithmetic at 38 cents demanded 78 and 72 percent. The market has lowered the bar by four points in 24 days. The models say it is still about a round too high, because a 74 percent favorite in a short series against a playoff club is rare, even for a rotation with Skubal at the front of it.
The two numbers are two estimates of the same event, 30.4 cents against 16.1 percent, and the settled contract will grade the call. Neither is proven wrong by a single outcome; a 16 percent shot wins about one time in six across a large sample of similar events, and a 30 percent shot about one in three. What the gap tells you is what each side is measuring. The panel is pricing a bracket. The market is pricing a belief about who the Dodgers become in October, plus the oldest bias in futures markets: the favorite tends to trade rich, the same force we track across every board on our sports prediction markets hub. On the NL champion board linked above, the same club, the same argument, one round shorter.
Brewers: The Contract The Money Found
Milwaukee is 87-53, the best record in baseball by four games over Atlanta and three and a half over Tampa Bay, on a plus-172 run differential, also the best in baseball, and nine games clear of the Cubs in the NL Central. The Brewers hold the National League's top bye, and seven of the eight seats had them strictly ahead of Los Angeles on August 22; GLM was the exception, with the two level at 16.0 each. The panel's rescaled median is 16.9 percent, first on the board. The market's price is 13.45 cents, second, and rising.
Milwaukee's contract turned over about $111,000 in face value in the 24 hours before this read. The Dodgers' contract did about $31,600 and the Yankees' about $26,000, so the club the panel had first out-traded the two clubs the market has first and third, combined, by nearly two to one. Trading volume is not direction; a contract can churn on its way down. But this one has moved from 9 cents to 13.45 in 24 days while its price gap to the panel shrank from about 8 points on August 10 to 4.6 on August 22 to 3.45 today. The money has been arriving on Milwaukee, and it has been buying.
The arithmetic at 13.45 cents with a bye is the cleanest thing on the board. Three series, and 13.45 percent across three rounds requires winning each one about 51 percent of the time. The market is asking the club with the best record and the best run differential in baseball to be a coin flip in every series it plays. The panel's 16.9 percent asks for about 55 percent per round across all three of them, a number that happens to sit close to, but is not the same thing as, the 55 percent Opus gave a stronger NL survivor over a weaker AL one in the World Series alone. The gap between the two clubs on the market is 17 cents, still larger than the entire price of every other club on the board. On the panel they sit less than a point apart.
The Bye Picture: What The Bracket Pays For In September
A bye is the one structural fact on this board that a price has to carry, because it removes a best-of-three that even a strong club wins only about 60 to 65 percent of the time. GLM put a number on it during the panel run.
The bye is worth roughly 3-4 points on this board: it skips a best-of-3 elimination series that even a strong club wins only ~60-65% of the time.
GLM, from the August 22 panel run
The MLB division odds board tracks the seeding math daily; here is where the playoff field stood on the afternoon of September 3, with each club's live price beside it.
| Slot | National League | Kalshi | American League | Kalshi |
|---|---|---|---|---|
| Bye 1 | Milwaukee Brewers, 87-53 | 13.45¢ | Tampa Bay Rays, 83-56 | 8.15¢ |
| Bye 2 | Atlanta Braves, 83-57 | 6.85¢ | Chicago White Sox, 73-66 | 3.85¢ |
| Division Winner, No Bye | Los Angeles Dodgers, 82-57 | 30.4¢ | Houston Astros, 71-69 | 3.25¢ |
| Wild Card 1 | Philadelphia Phillies, 79-61 | 6.2¢ | New York Yankees, 80-60 | 9.95¢ |
| Wild Card 2 | Chicago Cubs, 78-62 | 5.5¢ | Boston Red Sox, 75-65 | 4.95¢ |
| Wild Card 3 | Arizona Diamondbacks, 74-67 | 0.95¢ | Cleveland Guardians, 70-69 | 2.15¢ |
| Closest Out | San Diego Padres, 0.5 back | 1.7¢ | Texas, Toronto, Baltimore, 1.5 back | 1.25¢ / 1.05¢ / 0.3¢ |
Standings as of about 3:25 PM ET on September 3, 2026, after the Giants-Pirates matinee final, with Blue Jays-Guardians and White Sox-Astros in progress and every other club yet to play; Kalshi midpoints at 3:27 PM ET the same day.
The third row is the one to watch. The National League's no-bye division winner is the 30.4-cent favorite, a half-game behind Atlanta for the second bye. Atlanta is the club the panel liked most relative to its price after Milwaukee, at 9.6 percent against 6.85 cents, and its price has recovered nearly a cent since August 22 as it climbed back into the bye; Fable, Kimi and DeepSeek each gave the Braves 10 points or more. In the American League, the White Sox lead Cleveland by three in the Central and hold a bye at 3.85 cents, while Houston leads the West at 71-69 with a minus-42 run differential and no bye.
The Yankees, a wild card at 80-60 with a plus-115 run differential, trade at 9.95 cents, third on the whole board and ahead of four of the six division leaders. The AL pennant board linked above prices the same club one round shorter. The White Sox, who hold a bye the Yankees do not, trade at 3.85 cents. The panel saw the same thing the market did and priced New York at 9.6 percent anyway; its case was the run differential, plus-115 for New York against plus-51 for the Rays and plus-43 for Chicago. But it gave the White Sox 5.1 percent for the round they skip, and the market has been slowly agreeing: Chicago's contract has nearly doubled since August 10, from 2 cents to 3.85. The panel prices a 73-66 club with a bye at 5.1 percent, more than a point above the market's 3.85 cents. The market is still deciding.
Where The Market Wrote Its Own Script
Two contenders have moved away from the panel since August 22, and both moves are standings stories the models could not see.
Philadelphia at 6.2 cents is the one contender other than the Dodgers the panel priced below the market on August 22, at 4.4 percent against 4.95 cents, and the market has since added another 1.25 cents. The Phillies are 79-61 and hold the NL's first wild card at plus-36, the thinnest run differential of the National League's five best clubs by record, and by a wide margin; the Cubs, a slot behind them, are plus-132. The seats read that differential and priced Philadelphia as a wild card that has been outrunning its runs. The market is reading a 7-3 last 10 and paying for it. Outside the Dodgers-Brewers pair, this is the one row where I side with the panel's number over the market's direction, because a run differential is a better September predictor than a hot week, and the DFS version of the same mistake is chasing a stack because it went off last night.
Cleveland at 2.15 cents is the other. The Guardians were 63-66 and a game out of the wild card when the panel scored, and it gave them 0.9 percent. They are 70-69 now, holding the third AL wild card after a 7-3 stretch, and the contract has nearly tripled. Cleveland's direction the market has right: a club in a playoff spot is worth more than a club a game out of one, and the panel's number is frozen on a standings line that no longer exists. Whether it is worth 2.15 cents with a minus-8 run differential and a best-of-three to survive before it reaches anyone good is the same question the Phillies row asks from the other side.
Then there is the fade the panel missed. The seats gave Detroit 1.3 percent on August 22, four-tenths of a point above the market's 0.9 cents, and the market has since taken the Tigers to 0.15. Detroit, at 1 cent on August 10 with a plus-87 run differential at the time, is 64-75 now, 3-7 over its last 10 and six games out of the wild card, and the 1.15 points left behind are a gap the panel owns, not the market. The Tigers' run differential is still plus-47. The panel read the differential; the market read the roster that has to play September, because the arm at the front of the rotation that built that number pitches for the Dodgers, and tonight, in fact, he is on the DraftKings main slate at $10,500. Simulations grade the season that already happened, while prices grade the roster that plays the rest of it. It is the same trap we walk through in prediction markets for DFS players: a projection is only as current as its inputs, and the panel priced Detroit's run differential 19 days after the arm that built it had left.
Two clubs below the contender line are worth a sentence each. San Diego at 1.7 cents is a half-game out of the NL's third wild card and the panel had the Padres at 3.2 percent, the widest positive gap on the board for a club currently outside the playoff field. Boston at 4.95 cents has bled two cents since August 10 while the panel sits at 7.0, on a club holding the AL's second wild card at plus-77; the market appears to be pricing the 4-6 last 10 and the best-of-three ahead. Both are the kind of row a DFS player recognizes: a solid median that the field has stopped paying attention to.
The DFS Read: Tonight's Slate Is The Board In Miniature
Zoom back out to why a DFS site runs this page. The market says the Dodgers, the models say the Brewers, and both are answering different questions: who has the best roster for a short-series tournament, and who has produced the best season. A DFS player lives in exactly that gap every night, deciding when to pay for the highest projection at the highest ownership and when to take equal median at a fraction of the cost. Tonight's six-game DraftKings main slate, locking at 7:15 PM ET, happens to put the two ends of this board on the same DFS slate.
Milwaukee is at Wrigley in the early window with Logan Henderson on the mound at $9,500 against Kevin Gausman at $8,100 for the Cubs. The Brewers' bats are priced well below the slate's marquee names: Jackson Chourio is $5,600, Brice Turang $5,300, Christian Yelich $4,400 and William Contreras $4,300, while the Cubs' side carries Pete Crow-Armstrong at $7,000, Alex Bregman at $6,000 and Seiya Suzuki at $5,500. Los Angeles hosts St. Louis in the late window with Skubal at $10,500, a thousand over Henderson, against Quinn Mathews at $6,700, with Shohei Ohtani at $6,500 and Freddie Freeman at $5,000 in the lineup. Tampa Bay is at Texas with Shane McClanahan at $7,700 against Cal Quantrill at $7,300. The salaries are DraftKings' own, and two pitchers a DFS player might look for are not available tonight, Brandon Woodruff for Milwaukee and Roki Sasaki for Los Angeles, both flagged on the injured list. The projections and ownership that turn those salaries into a decision land in the DataHub for every slate; I have not invented a projection or an ownership number here, because the whole point of the page is that a number you did not fetch is a number you should not trust.
The read is the same one the futures board teaches. The field's version of paying 30 cents for a 16 percent team is paying up for the most expensive arm actually taking the mound tonight, the price tag that usually collects the field, and calling it safe. The field's version of Milwaukee at 13 cents is a Brewers stack, several hitters from one lineup, against Gausman at a price that does not carry the favorite's tag. Run the same arithmetic downward and the miniature gets literal. Skubal at $10,500 is asking for the 74-percent-per-round performance the market is buying at 30.4 cents. Henderson at $9,500 is asking to be the coin flip Milwaukee is at 13.45. And the four Brewers bats above, Chourio, Turang, Yelich and Contreras, cost $19,600 together, four hitters off the best run differential in baseball against a Gausman price that sits $2,400 below Skubal, the priciest of tonight's probable starters. Both are the shape of a decision rather than a pick, and the MLB DFS projections, ownership and stacks in the DataHub are where the shape becomes a number you can defend. If you have never run a slate through it, the Stokastic Sims are free to try, and today's slate walkthrough is on our MLB DFS picks page.
Sim the split before you build it. Our MLB Data + Sims package runs tonight's six-game slate thousands of times with projections, ownership and the Top Stacks tool built in, so the Brewers-versus-Dodgers read above becomes exposure numbers you can defend. Code WSODDS10 takes 10 percent off your first week or month.
From Cents To Payouts
A Yes contract pays one dollar if the club wins the World Series, so the price in cents reads directly as an implied probability, and the payout follows from it. Two adjustments keep the read honest. First, this board's 30 midpoints sum to about 102.6 cents, so each club's true market share is slightly below its sticker. Second, Kalshi's published fee schedule charges a trading fee of roughly 7 percent of price times one minus price per contract, which is largest for contracts near 50 cents.
Worked Example: What A 30-Cent Favorite Really Costs
Buy one Dodgers Yes at 30.4 cents and the fee is about 0.07 x 0.304 x 0.696, roughly 1.5 cents, so the all-in cost is closer to 31.9 cents and the break-even rises from 30.4 percent to about 32 percent. In payout terms, $100 at 30.4 cents buys about 329 contracts before fees, which turn into about $329 if Los Angeles wins and nothing if it does not. Stack that on the path math from earlier: at four rounds, a 32 percent break-even requires winning each series at about a 75 percent clip. A Brewers Yes at 13.45 cents carries a fee near 0.8 cents and an all-in cost around 14.3 cents; the same $100 buys about 743 contracts before fees and turns into about $743 if Milwaukee wins.
The fee is not the only cost this page can put in dollars, because it has its own August 10 read to grade against. Here is what a contract bought at that read is marked at today, before any fee, across the six most expensive clubs.
| Club | Aug 10 | Sept 3 | Change per contract | Fee to buy today |
|---|---|---|---|---|
| Los Angeles Dodgers | 38¢ | 30.4¢ | -7.6¢, down about a fifth | about 1.5¢ |
| Milwaukee Brewers | 9¢ | 13.45¢ | +4.45¢, up about half | about 0.8¢ |
| New York Yankees | 10¢ | 9.95¢ | -0.05¢ | about 0.6¢ |
| Tampa Bay Rays | 6¢ | 8.15¢ | +2.15¢, up about a third | about 0.5¢ |
| Atlanta Braves | 7¢ | 6.85¢ | -0.15¢ | about 0.4¢ |
| Philadelphia Phillies | 4¢ | 6.2¢ | +2.2¢, up more than half | about 0.4¢ |
Fee is Kalshi's published schedule, about 7 percent of price times one minus price, per contract, at the September 3 midpoint. Changes are mark-to-market, not settlement.
The Dodgers row is the one that grades this page. A favorite bought at the August 10 read is marked down a fifth, and the club this page called underpriced the same day is marked up by half. Neither number is money yet: every contract on this board still pays exactly $1.00 or exactly $0, and the only mark that counts is the one on the champion's contract in November. The asymmetry, the toll being heaviest exactly where the price is already richest, is the quiet reason a contested favorite is usually the most expensive thing on an exchange, and the reason to re-run the arithmetic at whatever price you are actually shown. The fee mechanics are walked through in full in how to bet MLB on Kalshi.
The Bottom Line
The board re-prices every night from here to the end of the regular season, and these are the developments that move specific numbers, with the direction stated in advance. Los Angeles reclaiming the NL's second bye from Atlanta shortens its path by a round and hands the market's 30.4 cents its best argument; Atlanta holding it does the opposite and makes the Braves' 6.85 cents the cheapest National League bye on the board. Milwaukee clinching the top seed removes the last variable from a 13.45-cent contract that already asks for coin flips. Cleveland or Boston losing the AL's second or third wild card to Texas, Toronto or Baltimore re-prices three contracts at once, and San Diego passing Arizona for the NL's third spot makes the Padres' 1.7 cents the board's most obvious stale number. Philadelphia's run differential catching up to its record, or not, decides the one row outside the favorite where I am siding with the models over the money.
Step back and the market and the models agree on 29 of 30 clubs to within a few cents. The one place they part company by more than four points is the favorite, and the market has spent 24 days walking toward the panel without arriving. The Milwaukee contract that out-traded the Dodgers and Yankees combined is what that walk looks like in turnover. Whether it finishes is what the settled contract will grade, in public, in the Sims vs. Kalshi ledger alongside the daily version of this exercise in Kalshi MLB picks today, the human-versus-machine version in Lindy vs. the machine on World Series odds, and the World Series matchup board linked above that prices the specific October pairings. Award boards price the same way, playing time and role before narrative, as the MLB home run leader market shows, and the football version of this page, NFL predictions week by week, grades its own board as the season opens.
Each club carries a yes/no contract on Kalshi that settles at $1.00 if that club wins the 2026 World Series and $0 if it does not, with an expected expiration of November 1, 2026. Every number above gets graded at that settlement, and this page carries the next read, the same frozen panel, and the settled result by the time the postseason field is set.
- Eligibility. Kalshi is a CFTC-regulated event-contract exchange; whether its sports contracts count as sports wagers under state law is in active litigation, and a federal appeals court, the Ninth Circuit, ruled on August 28, 2026 that they do.
- **Not Advice. Event contracts involve risk, and you can lose money trading them. Treat the market read as one input among many.
Panel verdicts generated August 22, 2026, price-blind, eight seats reporting, from the OddsShopper AI panel board. Prices as of September 3, 2026, 3:27 PM ET, from Kalshi's live order book; 24-hour and lifetime volume figures are face value as reported by Kalshi, about $65.6 million lifetime with about $47.3 million in open interest across the 30 contracts. Standings from the league's feed at about 3:25 PM ET on September 3, after the Giants-Pirates matinee final, with the Blue Jays-Guardians and White Sox-Astros games in progress and the evening slate yet to start. DraftKings salaries and roster status from the live six-game main-slate board, read September 3, 2026 at about 3:30 PM ET. DraftKings Sportsbook futures via ESPN's futures page the same afternoon. Models are frequently wrong; the market price reflects real traders' money.
More on this: Rams Vs 49ers First Touchdown: The Sims Say Nacua, Kalshi Says A Back · NASCAR Championship Odds: Hamlin At 42% With 13 Races Left · NBA Championship Odds 2027: Champion Knicks At Just 9% · NFL Playoff Odds: Stokastic Sims Vs Kalshi Prices · The Sims Vs Kalshi Ledger: Every Call, Graded In Public
Stokastic MLB Data + Sims. Turn the gap between the market and the models into simulated lineups with projections, ownership and stacks for every slate of the stretch run. WSODDS10 = 10% off your first week or month.
Use code WSODDS10
Get Started