
DraftKings MLB DFS Cheat Sheet For August 13: Projections, Ownership, And Stacks
By Sam Smith
August 13, 2026
Most days an MLB DFS cheat sheet spreads its chalk around. Today's does the opposite. The two highest-projected arms on the August 13 board are Logan Gilbert and Max Fried, they own the two biggest ownership numbers on the sheet, they sit first and second in top-150 exposure, and they are pitching against each other at Yankee Stadium — which happens to be one of the three best home-run parks in baseball. Meanwhile the two board arms throwing in the slate's most run-suppressing parks sit under 25% ownership apiece. That inversion is the whole story of this slate, and the way out of it runs through a bat the exposure panel loves and the stack panel barely builds. It is not in the Bronx.
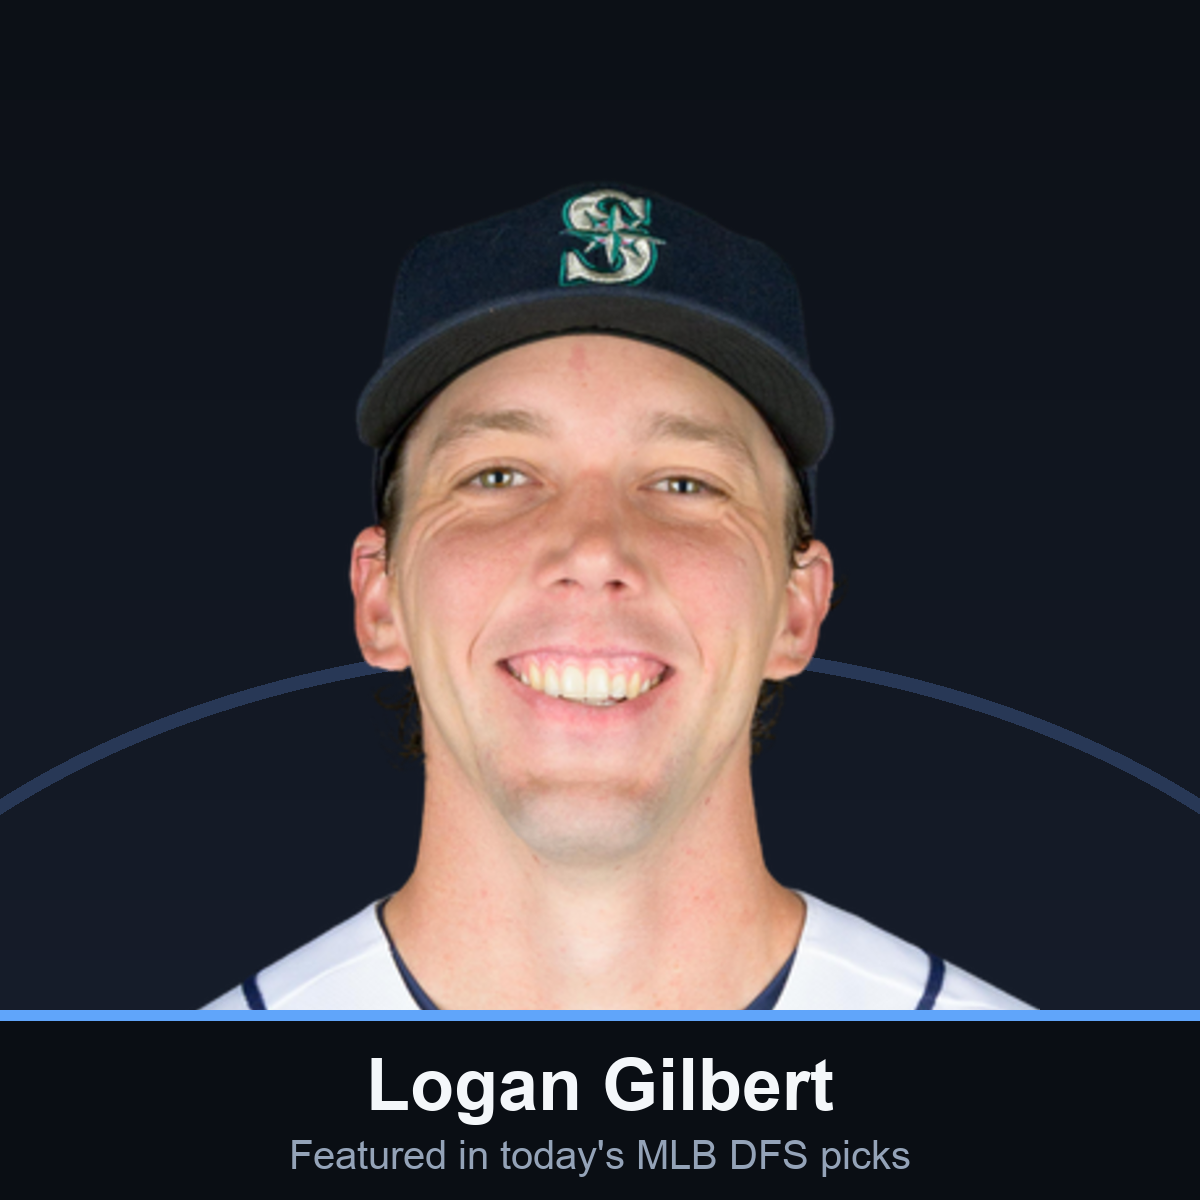
Logan Gilbert — one of the featured players on today's slate.
The Quick Answer
Logan Gilbert (18.0 projected DraftKings points, 39.2% ownership) and Max Fried (17.3, 35.2%) are the board's chalk, but they oppose each other in a top-three home-run park, so rostering both concentrates your entire build on one game staying quiet. Parker Messick is the pivot — 15.4 projected at 22.8% ownership, a 2.57 ERA, and Comerica Park behind him. The bat edge is Cal Raleigh (26.8% leverage) and Jazz Chisholm Jr. (25.4%) attacking those two chalk arms, and CJ Abrams — 34.7% exposure against roughly 13.6% implied field ownership — as the secondary piece worth paying up for. The full six-panel board, the DraftKings two-pitcher math, and a worked Washington build are below.
Today's Board: Six Games Carry Six Panels
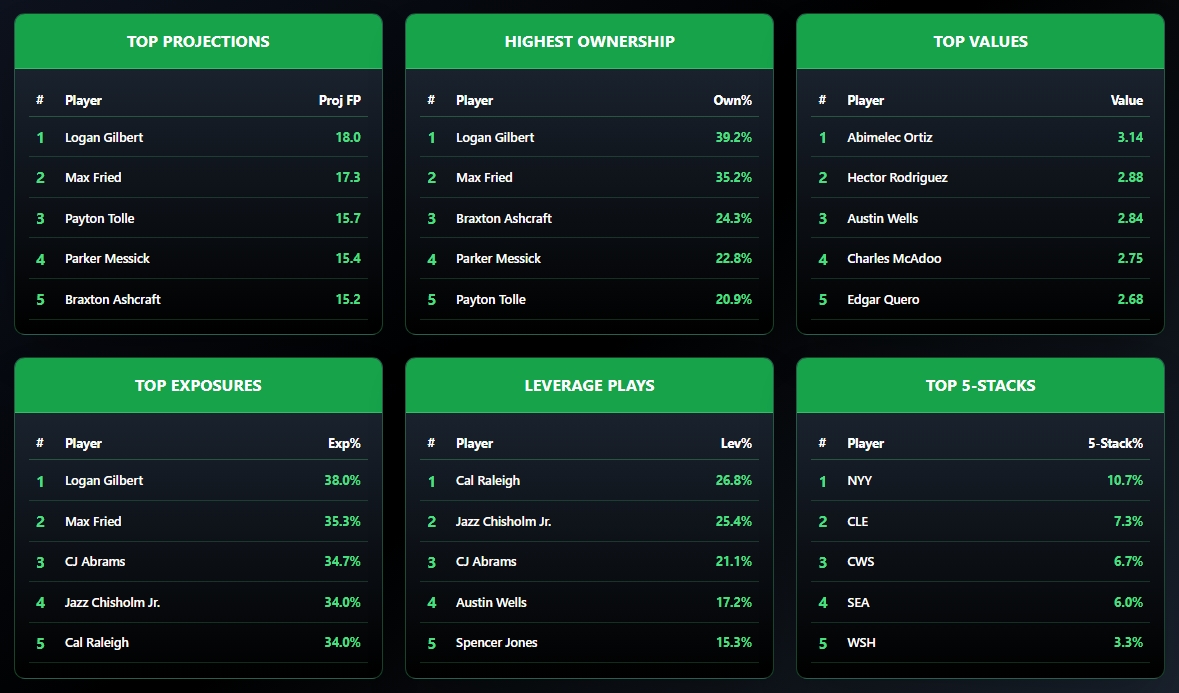
Nine games are on the MLB schedule today, but every one of the 30 rows on this cheat sheet comes from just six of them — the block that first-pitches between 1:10 p.m. and 4:05 p.m. ET. The other three (Phillies-Twins at 7:30 p.m. ET, then Rangers-Angels and Brewers-Dodgers after 10 p.m.) contribute nothing to any panel. Here is the entire August 13 board:
| Panel | 1st | 2nd | 3rd | 4th | 5th |
|---|---|---|---|---|---|
| Top Projections (Proj FP) | Logan Gilbert 18.0 | Max Fried 17.3 | Payton Tolle 15.7 | Parker Messick 15.4 | Braxton Ashcraft 15.2 |
| Highest Ownership (Own%) | Logan Gilbert 39.2% | Max Fried 35.2% | Braxton Ashcraft 24.3% | Parker Messick 22.8% | Payton Tolle 20.9% |
| Top Values (Value) | Abimelec Ortiz 3.14 | Hector Rodriguez 2.88 | Austin Wells 2.84 | Charles McAdoo 2.75 | Edgar Quero 2.68 |
| Top Exposures (Exp%) | Logan Gilbert 38.0% | Max Fried 35.3% | CJ Abrams 34.7% | Jazz Chisholm Jr. 34.0% | Cal Raleigh 34.0% |
| Leverage Plays (Lev%) | Cal Raleigh 26.8% | Jazz Chisholm Jr. 25.4% | CJ Abrams 21.1% | Austin Wells 17.2% | Spencer Jones 15.3% |
| Top 5-Stacks (5-Stack%) | NYY 10.7% | CLE 7.3% | CWS 6.7% | SEA 6.0% | WSH 3.3% |
The row that gives the game away is the leverage panel. Four of its five names — Raleigh, Chisholm, Wells and Jones — play in the Mariners-Yankees game. The sims are not spreading their edge across the slate today; they are pointing almost all of it at the one matchup the field has decided is a pitchers' duel.
A quick definition, because it does the work in every section below: Proj FP is the median projected DraftKings score, Own% is projected field ownership, Value is projected points per $1,000 of salary, Exp% is top-150 exposure (how often a player lands in the 150 highest sim-ROI lineups), Lev% is the gap between that optimal exposure and field ownership, and 5-Stack% is how often the Sims build a given five-batter team stack.
Why The Two-Pitcher Slot Changes How You Read This Sheet
A DraftKings MLB classic roster is ten slots under a $50,000 cap: two pitchers, then catcher, first base, second, third, short and three outfielders. That second pitcher is why the projection and ownership panels on a DraftKings cheat sheet skew so heavily toward arms — five of the top five projections today are starters, and so are all five ownership rows. On a single-pitcher site those same names would be competing for one slot and the ownership would split. Here it doubles up, which is the most consequential of the differences between the two platforms.
It also creates today's specific trap. Gilbert at 39.2% and Fried at 35.2% are not two independent decisions, because they are throwing to each other's lineups. Roster both and you have not diversified your pitching; you have made one enormous bet that the Bronx game stays under control. If it does not, both slots break at once, and roughly a third of the field breaks with you.
The exposure panel says the Sims are fine with that risk at roughly field weight: Gilbert's 38.0% exposure sits just under his 39.2% ownership, and Fried's 35.3% is a rounding error from his 35.2%. Neither generates a leverage row. That is the engine telling you these two are correctly priced by the crowd — not that they are wrong, just that there is no edge left in them.
The Chalk Is Standing In The Wrong Park
Here is where the environment argues with the ownership. Yankee Stadium carries one of the three highest home-run factors in the sport. Gilbert has given up 19 home runs in 139.1 innings this season, a 1.23 HR/9, the second-highest mark among the five arms on this board. So the single most-owned player on the slate is a fly-ball-vulnerable right-hander in a park built to punish exactly that.
Now compare the two board arms pitching in the most run-suppressing parks:
- Parker Messick (CLE), 22.8% Owned — 2.57 ERA, 0.86 HR/9, 25.1% strikeout rate, pitching at Comerica Park, one of the two most run-suppressing venues on this board.
- Braxton Ashcraft (PIT), 24.3% Owned — the ugliest ratios of the five (4.08 ERA, 1.29 HR/9), but a 26.6% strikeout rate, and he is throwing at loanDepot park, the toughest park to hit a home run in among today's six board games.
Messick is the cleaner of the two by a distance. He has the lowest ERA and the second-lowest HR/9 of any arm on this sheet, his projection (15.4) sits within 2.6 points of Gilbert's, and he costs you 16.4 points of ownership. On a board this top-heavy, that is the cheapest real pivot available.
Ashcraft is the shakier call and I want to be honest about why the sheet still likes him: his 15.2 projection is being carried by strikeout upside and a park that erases his one real flaw, not by his run prevention. He is a tournament arm, not a safe one.
Payton Tolle rounds out the group with the highest strikeout rate of the five arms here at 28.5%, but he draws a Toronto lineup that gets the platoon edge on a left-hander, which is a real reason his 15.7 projection comes with only 20.9% ownership.
The Stacks Are Attacking The Chalk
Read the stack panel against the ownership panel and the conflict is deliberate:
| Stack | 5-Stack% | Opposing starter | That starter's HR/9 |
|---|---|---|---|
| NYY | 10.7% | Logan Gilbert (39.2% owned) | 1.23 |
| CLE | 7.3% | Keider Montero | 0.96 |
| CWS | 6.7% | Andrew Abbott | 1.19 |
| SEA | 6.0% | Max Fried (35.2% owned) | 0.11 |
| WSH | 3.3% | Kevin Gausman | 1.07 |
The Sims build the Yankees five-stack more often than any other, and that stack exists to beat the most-owned player on the slate. Chisholm, Wells and Jones are all left-handed hitters facing a right-hander in a park with a short porch in right field, which is the cleanest structural argument on the board — and a textbook case of the correlation that makes stacking work in the first place.
The merits underneath are thinner than the setup suggests, though, and pretending otherwise would be doing you a disservice. Against right-handers this season Chisholm has a .189 ISO with 13 home runs — genuine power. Wells is at .208/.314/.339 with a .131 ISO, and Jones is at .192/.286/.323. Jones is the interesting one: his surface line against righties is poor, but his overall batted-ball quality is elite, with a 12.5% barrel rate and a 58% hard-hit rate on the season. His results have not caught up to his contact yet, which is exactly the profile a simulation rewards and a box-score reader ignores.
The Seattle stack is the one I would push back on hardest. Fried has allowed one home run all season — a 0.11 HR/9 that is the lowest mark among all 18 starters on today's schedule. Stacking Seattle asks the most homer-proof starter on this slate to hand you a crooked number, and Cal Raleigh, the sheet's top leverage play, is hitting .142 with a .499 OPS against left-handers. The 26.8% leverage number is real, but it is a statement about how far the field has walked away from him, not a statement that he is in form.
The Value Panel Is A Salary Column, Not A Talent Ranking
Every name on the value panel is a bat, and value here means projected points per $1,000 of salary — so this panel is measuring price, not quality. Treat it as a list of ways to afford the rest of your roster.
Abimelec Ortiz (WSH) tops it at 3.14. Héctor Rodríguez (CIN) is second at 2.88, Austin Wells (NYY) third at 2.84, Charles McAdoo (TOR) fourth at 2.75 and Edgar Quero (CWS) fifth at 2.68. Wells is the only name on the value panel who turns up anywhere else on the sheet — he is also fourth in leverage at 17.2% — which makes him the natural salary-relief piece inside the Yankees stack rather than a bat you are excited to roster on merit. His 7.1% barrel rate is the weakest of the five board hitters I have Statcast marks for, so treat him as a price, not a projection.
Two honest caveats on this panel. McAdoo's platoon edge against the left-handed Tolle rests on 17 plate appearances against left-handers, which is not a sample you should lean on. And Ortiz's .750 slugging against right-handers comes in 25 plate appearances — the underlying contact quality is excellent, but the batting line is noise at that volume.
I keep coming back to the fact that this panel and the leverage panel barely overlap. The sheet is telling you the cheap bats and the contrarian bats are mostly different players today, which means you will have to choose which one your last roster spot is for.
Worked Example: Building Around The Nationals Mini-Stack
This is the payoff I promised, and it comes with a wrinkle worth stating plainly. Washington is the stack the Sims build least often of the five, at 3.3%. That is not a hidden endorsement of the five-man stack — read literally, the engine is telling you it rarely wants all five Nationals together.
What it does want is one of them, badly. And the arm they face is Kevin Gausman, whose 4.29 ERA is the highest of any starter these five stacks draw, alongside a 1.26 WHIP and a .254 opponent average.
Start with CJ Abrams. He is third in top-150 exposure at 34.7% and third in leverage at 21.1%. Subtract the leverage from the exposure and the two panels imply the field is on him at roughly 13.6% — the Sims want him at about two and a half times the crowd's rate. That is the resolution: the value is in the individual bat, not the full stack, which is exactly why he belongs in a three-man secondary rather than a primary five. His case against right-handed pitching this season is the biggest single-bat outlier on the board: .298/.385/.585 with a .287 ISO and 23 home runs in 348 plate appearances, backed by a 10.4% barrel rate and 42% hard-hit rate. Gausman throws right-handed, so Abrams gets that split all afternoon.
Abimelec Ortiz is the second Washington piece, and he is the sheet's No. 1 value at 3.14, which is how you pay for the rest of the build.
So the shape is: a three-man Washington mini-stack anchored by Abrams and Ortiz, paired with a five-man primary stack from the sheet — DraftKings caps you at five hitters from one team, and pitchers do not count toward that cap, so five plus three plus two arms fills the roster exactly. If your primary five is the Yankees at 10.7%, your two pitchers cannot include Gilbert, since he is the man your stack is attacking. Messick and Ashcraft fill those slots at a combined 47.1% ownership — well under the 74.4% the Gilbert-Fried pairing costs you, and split across two different games instead of concentrated in the one your bats are trying to blow up.
That build fades the single most-owned player on the slate, keeps the sheet's most-built stack, and borrows the best bat from its least-built one. It is not the safe lineup. It is the one the exposure and leverage panels actually describe, and it follows the shape most tournament builds want on a top-heavy board.
You can pull today's MLB DFS projections, ownership and stacks in the DataHub if you want to see the full board these panels are drawn from, rather than just the top five of each. If you would rather start from a written slate read, our MLB DFS picks for today covers the same games from the other direction.
Where The Free Sheet Stops And The Sims Start
Every panel above comes out of the Stokastic Sims, which simulate this exact slate tens of thousands of times instead of ranking players off one static projection. That distinction is not marketing. A static projection cannot tell you that Chisholm, Wells and Jones tend to score together, because it treats them as three independent numbers; a simulation that runs the whole game keeps them correlated, which is the only honest way to price a five-man stack. The same engine models ownership as a distribution rather than a single guess, which is where Lev% comes from, and it derives the exposure column from sim ROI across the top-150 lineup pool rather than from anyone's opinion — a different foundation than conventional DFS projections are built on.
The cheat sheet is free, and it always will be. What it shows you is the top five rows of each panel — the preview. The Sims themselves, the full ownership projections, the complete ROI-ranked lineup pool and the Boom/Bust distributions behind these numbers are the paid product, and they are what let you see the rest of the player pool the top-five panels above cut off.
Code CHEAT takes 15% off your first week or month of a Stokastic MLB DFS package.
More on this: MLB DFS Hub: Every Live Stokastic MLB Page · DraftKings MLB DFS Cheat Sheet: Projections, Ownership & Stacks For August 3 · FanDuel MLB DFS Cheat Sheet: Projections, Ownership & Stacks · DraftKings NFL DFS Cheat Sheet: Week 1 Picks And Stacks · DraftKings PGA DFS Cheat Sheet: Sims, Projections And Ownership
Where I Land On The August 13 Slate
The thing worth carrying out of this board is not any single name — it is that the crowd and the ballpark disagree today, and the sheet is siding with the ballpark. The two most-owned arms on the sheet combine for 74.4 points of ownership and they are throwing to each other in a park built to ruin pitchers, and the Sims have answered by building their most frequent stack against the more popular of the two. That is a coherent position, not a contradiction.
Where I actually differ from the sheet is Seattle. Attacking a starter who has allowed one home run in 81.1 innings is the one place today where the leverage number is describing the field's exhaustion rather than a real opening, and Raleigh's line against left-handers backs that up. Take the leverage where the matchup earns it instead — Abrams against Gausman, at roughly 13.6% implied ownership — and let someone else pay 39.2% for the view from the Bronx.
Lineups can change before lock, and these games start in the early afternoon, so confirm the probables and the batting orders before you submit. This is projection and leverage analysis, not a promise about how the slate plays out. 21+.