(48) Denver Broncos (22.5) @ Los Angeles Chargers (25.5)
All Graphs Reflect Last Five Weeks of Data, Click Graphs to Enlarge
Team Passing and Pace
First, let’s take a look at the possibility of this game turning into a shootout, as teams that play faster and pass more than average tend to score more fantasy points. When both teams play aggressively, it often creates a game environment perfect for fantasy scoring. Games have a higher probability of going over their Vegas total as well. Ideally, we’re seeking matchups where both teams are in the upper-right quadrant of the chart below (see the chart’s caption for more details).
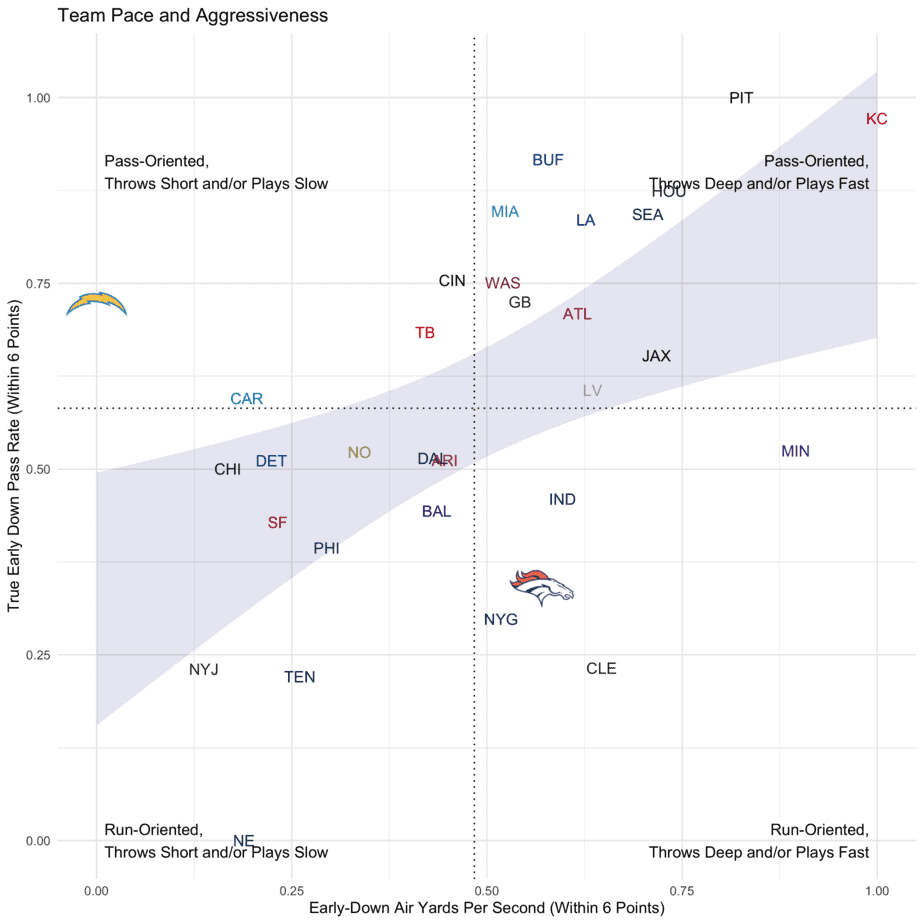
For fantasy gamers hoping for a shootout, Justin Herbert is our only hope. While the Chargers remain a slow-paced team compared to the rest of the league, they’re also getting more comfortable with the idea of putting the ball in Herbert’s hands more often, particularly in close games, as the Chargers are now well above league-average in true early-down pass rate in neutral situations. The Broncos are a relatively vanilla offense, clustered with other run-oriented, average-paced offenses like the Giants and Browns.
Recent Quarterback Performance
Next, let’s examine the starting quarterbacks’ recent play. Sustained drives in the NFL rely on efficiency at the quarterback position, so I’ve identified my three favorite performance indicators for assessing quarterback performance. The three bar charts below (see the graph’s caption for more detail) represent a quarterback’s per-drive efficiency (left bar-chart), per-play efficiency including rushes/scrambles (center) and per-pass efficiency (right). Higher rankings from both players indicate a higher likelihood of efficient play, thus a higher probability of fantasy points.
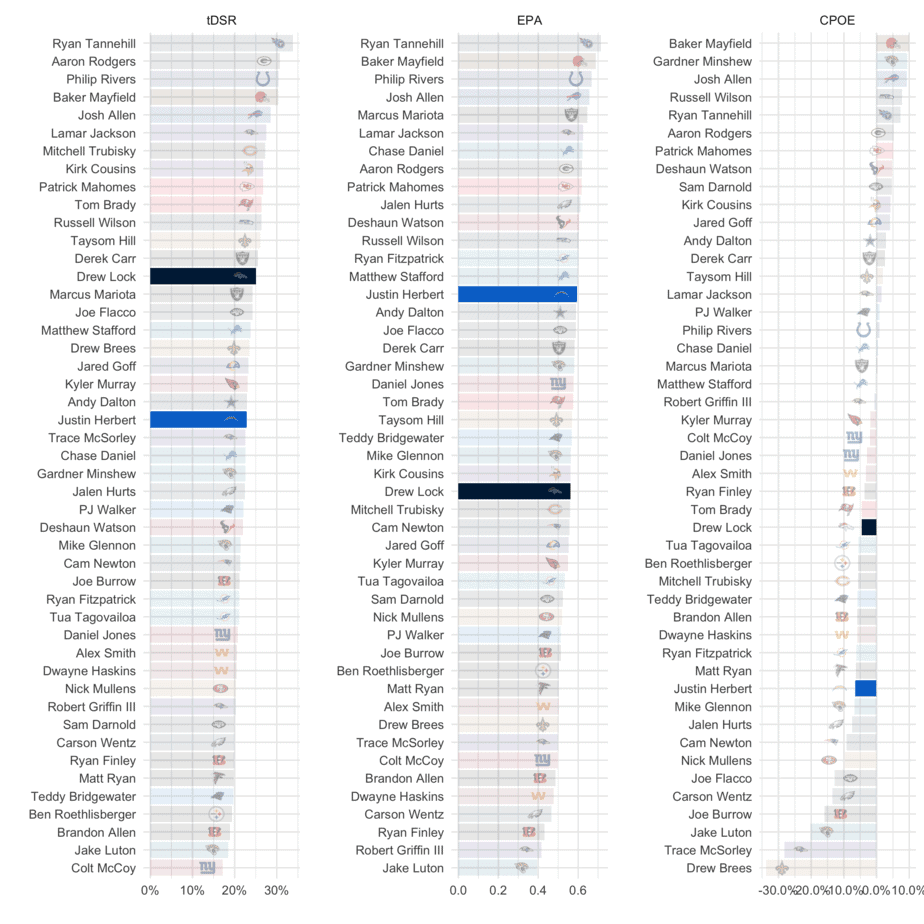
While Herbert’s put up some strong overall numbers as a passer, his effecieny metrics still leave a bit to be desired, as Herbert actually ranks worse than Broncos’ quarterback Drew Lock on a per-drive and per-pass basis over the last five weeks. Lock’s metrics are better than expected, just enough that he should be fantasy gamers’ radars this weekend, even against the typically stout Chargers’ secondary.
NFL DFS Player Pool Picker: Upside Analysis
Now, let’s examine the primary skill players from each offense. Unless participating in a large-field tournament, these are the players you should be focusing on in your daily fantasy football lineups. For each player, I’ve made it easy to compare their per-game fantasy (in column 3) to their DraftKings main slate salary ranking (in column 2). Column 4 ranks the player using my favorite position-specific volume metric: Expected fantasy points, which is curated by PFF. The Defense vs. Position column is an extremely helpful position-specific and player-group specific (for example, the metric delineates between primary wide receiver vs. secondary wide receivers) metric that helps determine if an offensive player is likely to be in a position to exceed their expected fantasy points. Higher numbers in the Defense vs. Position column indicate easier matchups for the offense, while numbers closer to one indicate a stout defense against that specific position-group.
The final column, Expected Projection, combines a player’s expected fantasy points with their weekly matchup into one helpful value metric. Apart from the Awesemo projections (which should still carry the most weight in determining player value), Expected Projection is one of my favorite metrics to help me narrow down my favorite plays of the week. The rankings are always specific to the slate, meaning if a player or team is ranked No. 1 at a specific metric, they may not necessarily be ranked No. 1 in the NFL, but they are for this specific slate.
Denver Broncos NFL DFS Core Offenses
| Team | Player | Positional Salary Rank | FPTs/Gm Rank | Expected FPTs/Gm Rank | Defense vs. Position | Expected Projection |
| DEN | Drew Lock, QB | #18 | #7 | #18 | #16 | 19.5 Fpts (QB7) |
| DEN | Melvin Gordon III, RB | #19 | #11 | #22 | #20 | 13 Fpts (RB7) |
| DEN | Tim Patrick, WR | #36 | #19 | #39 | #4 | 9.5 Fpts (WR33) |
| DEN | Jerry Jeudy, WR | #47 | #63 | #68 | #21 | 8.5 Fpts (WR43) |
| DEN | Noah Fant, TE | #4 | #10 | #16 | #21 | 9.5 Fpts (TE8) |
| DEN | Phillip Lindsay, RB | #31 | #37 | #54 | #20 | 6 Fpts (RB31) |
| DEN | KJ Hamler, WR | #58 | #37 | #62 | #12 | 8.5 Fpts (WR43) |
Drew Lock stands out once again in this chart, as his expected projection ranks him well ahead of salary-based expectations. The same can be said for starting running back Melvin Gordon, who’ se only the 19th highest-salary running back on the slate. K.J. Hamler looks like a viable salary-saver option in all formats, but the Chargers have been strong against third wide receivers, ranking in the top-12 against the position group over the last five weeks.
Los Angeles Chargers NFL DFS Core Offenses
| Team | Player | Positional Salary Rank | FPTs/Gm Rank | Expected FPTs/Gm Rank | Defense vs. Position | Expected Projection |
| LAC | Justin Herbert, QB | #4 | #4 | #4 | #5 | 22 Fpts (QB3) |
| LAC | Austin Ekeler, RB | #3 | #8 | #6 | #29 | 18 Fpts (RB3) |
| LAC | Keenan Allen, WR | #5 | #4 | #10 | #10 | 17 Fpts (WR7) |
| LAC | Hunter Henry, TE | #5 | #6 | #9 | #2 | 9 Fpts (TE10) |
| LAC | Mike Williams, WR | #32 | #32 | #54 | #3 | 9.5 Fpts (WR33) |
| LAC | Kalen Ballage, RB | #35 | #26 | #29 | #29 | 10.5 Fpts (RB17) |
Besides Kalen Ballage, who seems like an interesting leverage play off-of Austin Ekeler, the primary weapons for the Chargers all have expected projections that are right in-line with salary-based expectations. It’s surprising to see so many Chargers’ players near the top of their position in salary rankings, but all four of Justin Herbert, Ekeler, Keenan Allen, and Hunter Henry seem like strong plays this Sunday.
NFL DFS Backfield Values: Running Back Opportunities
Nailing the running back position in your fantasy football lineups is vitally important. There are many metrics that help fantasy gamers determine which running backs earn higher-value touches than their peers, but my favorite is Quality Opportunities per game. It only counts running back looks that come via the receiving game (as receptions are much more valuable on a per-play basis than rushes) or via goal line rushes (inside the opponent’s 10-yard line) since there isn’t anything more valuable than a touchdown.
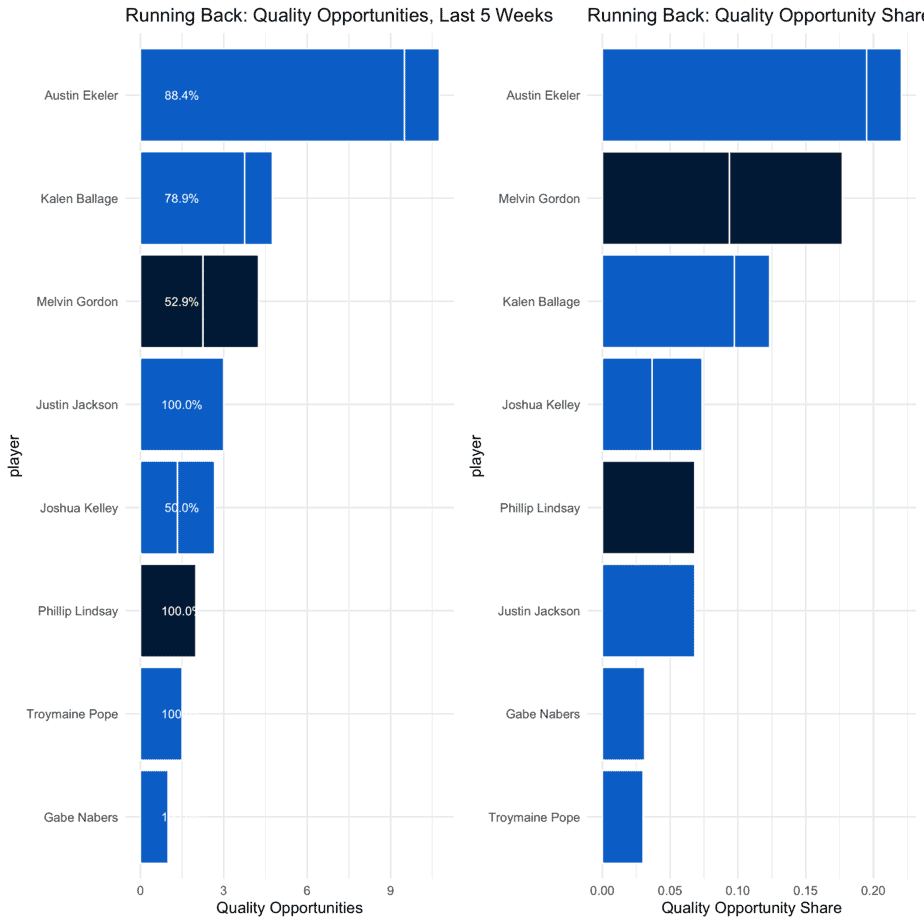
While Austin Ekeler continues to have unique upside operating as a receiver, the Chargers clearly like the idea of utilizing Kalen Ballage at the goal line, and leading to Ballage averaging more quality opportunities per game than Melvin Gordon. Gordon’s absolutely viable in all formats this weekend, but his metrics in the chart above are somewhat disappointing.
NFL DFS Receiving Values: Skill Position Opportunity Ranges
The wide receiver and tight end positions are two of the higher-variance positions in all of daily fantasy football, so it’s important to consider both floor and ceiling when predicting a player’s usage. Players with unexpectedly high opportunity in the passing game often have the best chances to outperform their projections, so I created a chart that measures a player’s opportunity range of outcomes (see the caption of the graph for more details on how this is calculated.). The horizontal bars represent a player’s expected opportunity range, while the center dot represents their average opportunity.
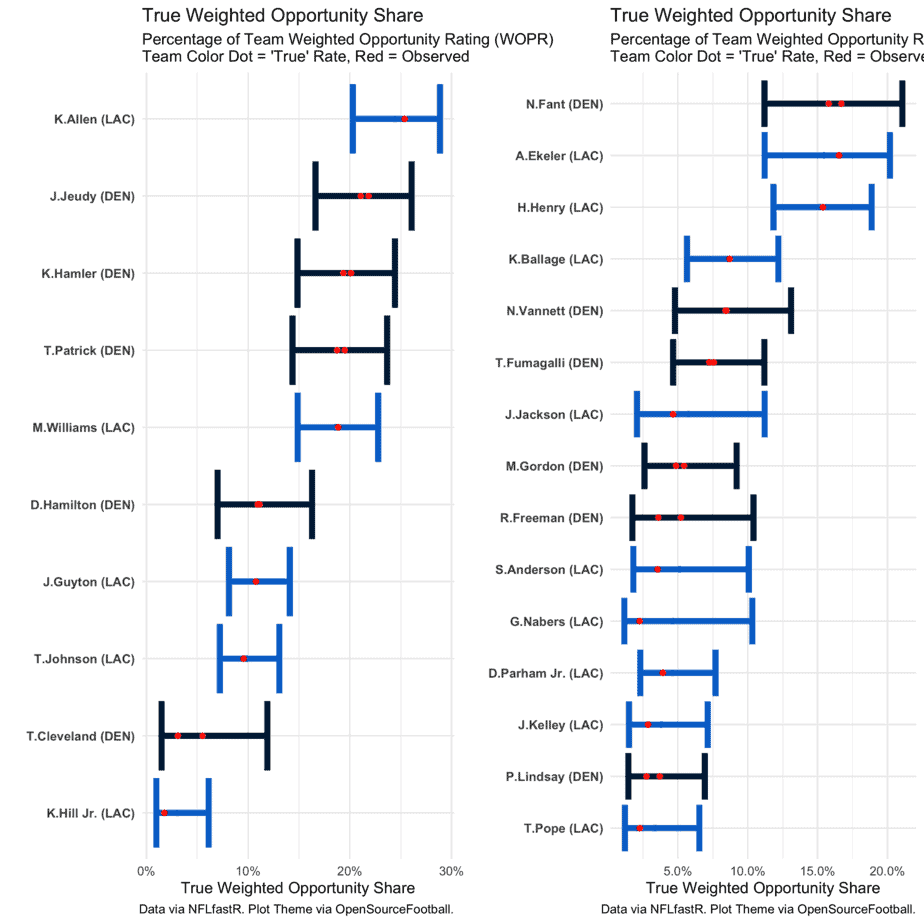
If this game does see more scoring than expected, Jerry Jeudy will likely be valuable, don’t rule out Tim Patrick or K.J. Hamler as the primary beneficiaries, as all three are jockeying for the opportunity lead for Denver when factoring-in air yards. Mike Williams is still more appealing than the Denver trio due to the Chargers’ higher passing volume/
NFL DFS Auxiliary Offensive Players for Large-Field Contests
In daily fantasy football, depending on the size and type of contest you’re playing, it’s often advantageous to expand your player pool to less-utilized offensive players. In this section, we examine every part-time player’s usage based on playing time, opportunity and (again) defensive matchup. For each player, I create an Opportunity Score, which scales a position-specific opportunity metric between zero (least valuable) and 100 (most valuable). Scores above 50 tend to indicate starter-level opportunity, while scores over 80 indicate star-level usage. Finally, I categorize the players as an NFL DFS value, a mass multi-entry option (MME-only) or a player to avoid altogether.
Denver Broncos NFL DFS Tournament Picks
| Team | Player | Snap Share | Opportunity Score | Defense vs. Position | Outlook: Value, MME-only, Look Elsewhere |
| DEN | Nick Vannett, TE | 36% | 48 | #21 | Look Elsewhere |
| DEN | Royce Freeman, RB | 9% | 22 | #20 | Look Elsewhere |
| DEN | DaeSean Hamilton, WR | 37% | 34 | #12 | Look Elsewhere |
Los Angeles Chargers NFL DFS Tournament Picks
| Team | Player | Snap Share | Opportunity Score | Defense vs. Position | Outlook: Value, MME-only, Look Elsewhere |
| LAC | Jalen Guyton, WR | 83% | 40 | #2 | MME-only |
| LAC | Tyron Johnson, WR | 30% | 29 | #2 | MME-only |
| LAC | Joshua Kelley, RB | 23% | 49 | #29 | Look Elsewhere |
| LAC | Donald Parham, TE | 19% | 24 | #2 | Look Elsewhere |
While Tyron Johnson and Jalen Guyton have both posted quality fantasy outputs at low ownership this season, their still extremely tough to bet on against a Broncos offense that has been surprisingly tough against opposing wideouts. Guyton’s 83% snap share over the last five weeks, compared to Johnson’s 30% gives him the slight edge between the two.
Final Thoughts
There’s absolutely a possibility this game becomes a low-scoring grind-it-out game, but assuming Justin Herbert remains efficient, he, along with his primary weapons: Austin Ekeler and Keenan Allen, should be the strongest plays from this game. The Denver offense isn’t completely devoid of upside, but the floor is significantly lower across the board for Drew Lock and the Denver skill-position players.
Prediction: Chargers 28, Broncos 21
Looking for more NFL DFS picks and daily fantasy football matchups content? We have loads of articles, data and more on the Awesemo NFL home page. Just click HERE.